## Scatter Plots: Peak Frequency Comparison Across Environments
### Overview
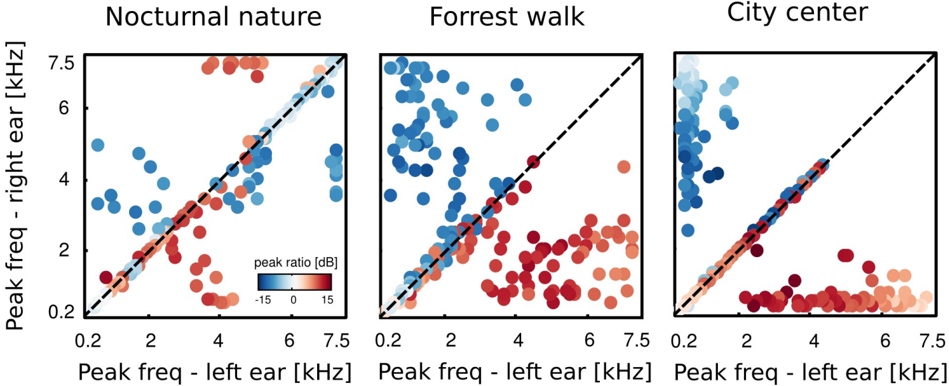
The image contains three scatter plots comparing peak frequencies between the left and right ears in three distinct environments: Nocturnal nature, Forrest walk, and City center. Each plot uses a dashed diagonal line (line of equality) to reference where left and right ear frequencies match. Data points are color-coded by peak ratio (dB), with blue indicating negative ratios (left ear > right ear) and red indicating positive ratios (right ear > left ear).
---
### Components/Axes
- **X-axis**: "Peak freq - left ear [kHz]" (range: 0.2–7.5 kHz)
- **Y-axis**: "Peak freq - right ear [kHz]" (range: 0.2–7.5 kHz)
- **Legend**: Located at bottom-left, labeled "peak ratio [dB]" with a gradient from blue (-15 dB) to red (+15 dB).
- **Plot Titles**:
- Top-left: "Nocturnal nature"
- Top-center: "Forrest walk"
- Top-right: "City center"
---
### Detailed Analysis
#### Nocturnal nature
- **Data distribution**: Points cluster near the dashed line (near 1:1 ratio).
- **Color trends**: Predominantly blue (negative ratios) with some red outliers.
- **Key values**:
- Most points between 0.5–4 kHz on both axes.
- A few red points (e.g., ~2 kHz left ear, ~1.5 kHz right ear) show +5 dB ratios.
#### Forrest walk
- **Data distribution**: Wider spread, with points scattered across the plot.
- **Color trends**: Mix of blue and red, with a concentration of red points (positive ratios) below the dashed line.
- **Key values**:
- Left ear peaks up to ~6 kHz; right ear up to ~5 kHz.
- Notable red cluster near 3–4 kHz left ear and 2–3 kHz right ear (~+10 dB).
#### City center
- **Data distribution**: Dense clustering below the dashed line (right ear < left ear).
- **Color trends**: Predominantly blue (negative ratios) with sparse red outliers.
- **Key values**:
- Left ear peaks up to ~7.5 kHz; right ear up to ~6 kHz.
- Blue points dominate near 1–3 kHz left ear and 0.5–2 kHz right ear (~-10 dB).
---
### Key Observations
1. **Nocturnal nature**: Balanced hearing (near 1:1 ratio) with minor deviations.
2. **Forrest walk**: Asymmetric hearing, with right ear frequently lower than left ear.
3. **City center**: Strong left-ear dominance (negative ratios), especially in low frequencies.
4. **Dashed line**: Acts as a reference for equal peak frequencies; deviations indicate environmental influence.
5. **Color coding**: Red points (positive ratios) are rare in City center but common in Forrest walk.
---
### Interpretation
- **Environmental impact**: Urban noise (City center) likely causes directional sound perception, favoring the left ear. Natural settings (Forrest walk) introduce variability, possibly due to uneven sound sources.
- **Frequency sensitivity**: Lower frequencies (<2 kHz) show the largest disparities, suggesting human hearing asymmetry is more pronounced in bass ranges.
- **Outliers**: Red points in Nocturnal nature and City center may indicate measurement errors or unique sound sources (e.g., machinery in cities).
- **Practical implications**: Findings could inform audio engineering (e.g., binaural recording techniques) or auditory health studies in noisy environments.
*Note: All values are approximate due to the absence of numerical annotations on the plot.*