## Line Graphs: Fraction of Under-Counting by Age Group and Madrid Data Comparison
### Overview
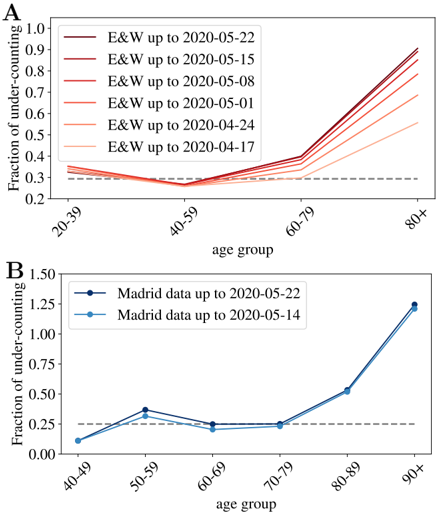
The image contains two line graphs (A and B) analyzing the fraction of under-counting across age groups. Chart A shows trends over multiple dates, while Chart B compares Madrid data across two specific dates. Both graphs highlight age-related disparities in under-counting.
### Components/Axes
**Chart A (Top Panel):**
- **X-axis**: Age groups (20-39, 40-59, 60-79, 80+)
- **Y-axis**: Fraction of under-counting (0.0 to 1.0)
- **Legend**: Dates (2020-04-17, 2020-04-24, 2020-05-01, 2020-05-08, 2020-05-15, 2020-05-22) with color gradients from dark red (earliest) to light orange (latest)
- **Legend Position**: Top-left corner
- **Trend**: All lines slope upward, with steeper increases in the 80+ age group.
**Chart B (Bottom Panel):**
- **X-axis**: Age groups (40-49, 50-59, 60-69, 70-79, 80-89, 90+)
- **Y-axis**: Fraction of under-counting (0.0 to 1.5)
- **Legend**: Madrid data up to 2020-05-22 (dark blue) and 2020-05-14 (light blue)
- **Legend Position**: Right side
- **Trend**: Both lines show upward trajectories, with the 90+ group exhibiting the sharpest rise.
### Detailed Analysis
**Chart A:**
- **20-39 Age Group**: All lines remain near 0.3, with minimal variation.
- **40-59 Age Group**: Lines hover around 0.3–0.4, showing slight increases over time.
- **60-79 Age Group**: Gradual rise from ~0.4 to ~0.6 across dates.
- **80+ Age Group**: Steep upward trend, reaching ~0.9 by 2020-05-22.
- **Key Data Points**:
- 2020-04-17: 80+ group ~0.3
- 2020-05-22: 80+ group ~0.9
**Chart B:**
- **40-49 Age Group**: Both Madrid datasets (~0.1–0.2).
- **50-59 Age Group**: Dark blue (~0.4) vs. light blue (~0.3).
- **60-69 Age Group**: Dark blue (~0.3) vs. light blue (~0.2).
- **70-79 Age Group**: Dark blue (~0.3) vs. light blue (~0.2).
- **80-89 Age Group**: Dark blue (~0.5) vs. light blue (~0.4).
- **90+ Age Group**: Dark blue (~1.3) vs. light blue (~1.2).
- **Key Data Points**:
- 2020-05-14: 90+ group ~1.2
- 2020-05-22: 90+ group ~1.3
### Key Observations
1. **Age-Related Disparities**: Under-counting increases significantly with age, particularly in the 80+ and 90+ groups.
2. **Temporal Trends**: Later dates (e.g., 2020-05-22) show higher under-counting fractions compared to earlier dates.
3. **Madrid Data Comparison**: The 2020-05-22 dataset consistently reports higher under-counting than the 2020-05-14 dataset, especially in the 90+ group.
4. **Steepest Increases**: The 80+ and 90+ groups exhibit the most pronounced upward trends, suggesting systemic under-reporting or data collection challenges for elderly populations.
### Interpretation
The data suggests that under-counting is not uniform across age groups, with the oldest populations (80+ and 90+) experiencing the highest discrepancies. This could reflect:
- **Data Collection Challenges**: Older individuals may be less likely to participate in surveys or have their deaths reported.
- **Temporal Factors**: The increase in under-counting over time (e.g., from 2020-04-17 to 2020-05-22) might correlate with events like the COVID-19 pandemic, which disproportionately affected elderly populations.
- **Regional Variations**: The Madrid data comparison indicates that later data collection periods (e.g., 2020-05-22) may have improved reporting, but the 90+ group still shows significant gaps.
The trends underscore the need for targeted data collection strategies for elderly populations to ensure accurate demographic and health statistics.