## Histogram: First Correct Answer Emergence
### Overview
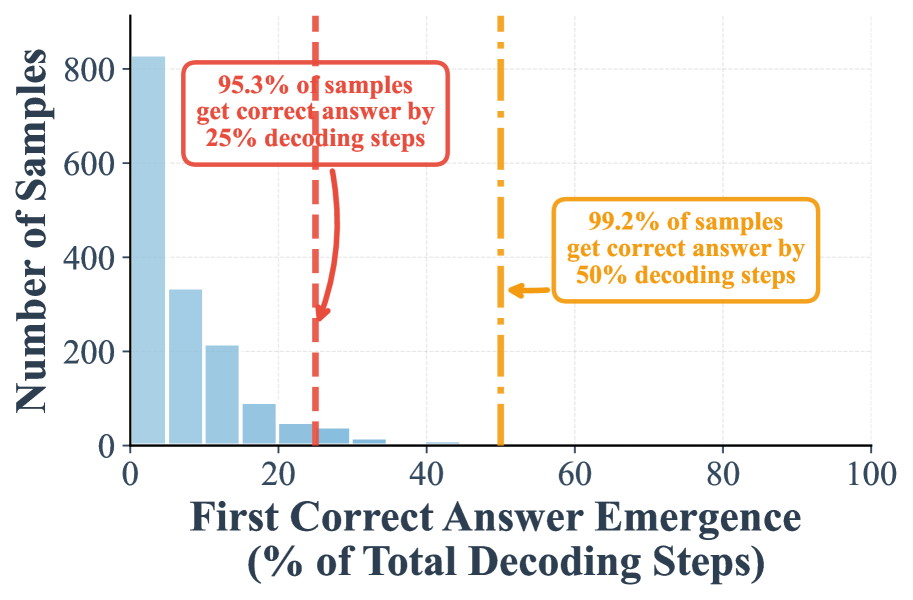
The image is a histogram showing the distribution of the "First Correct Answer Emergence" as a percentage of total decoding steps. It also includes annotations indicating the percentage of samples that achieve a correct answer by 25% and 50% of the decoding steps.
### Components/Axes
* **Y-axis:** "Number of Samples", ranging from 0 to 800 in increments of 200.
* **X-axis:** "First Correct Answer Emergence (% of Total Decoding Steps)", ranging from 0 to 100.
* **Bars:** Light blue bars representing the frequency of samples for each range of "First Correct Answer Emergence".
* **Vertical Dashed Red Line:** Located at approximately 25% on the x-axis.
* **Vertical Dashed Orange Line:** Located at approximately 50% on the x-axis.
* **Annotations:**
* Red box: "95.3% of samples get correct answer by 25% decoding steps" with an arrow pointing to the red dashed line.
* Orange box: "99.2% of samples get correct answer by 50% decoding steps" with an arrow pointing to the orange dashed line.
### Detailed Analysis
* **Bar Heights (Approximate):**
* 0-5%: ~820
* 5-10%: ~320
* 10-15%: ~210
* 15-20%: ~90
* 20-25%: ~40
* 25-30%: ~15
* 30-35%: ~5
* 35-40%: ~2
* 40-45%: ~1
* **Trend:** The number of samples decreases as the percentage of total decoding steps increases. The distribution is heavily skewed to the left, indicating that most samples achieve a correct answer early in the decoding process.
* **95.3% Threshold:** A red dashed vertical line is placed at 25% of total decoding steps. An annotation indicates that 95.3% of samples get the correct answer by this point.
* **99.2% Threshold:** An orange dashed vertical line is placed at 50% of total decoding steps. An annotation indicates that 99.2% of samples get the correct answer by this point.
### Key Observations
* The vast majority of samples achieve a correct answer within the first 25% of decoding steps.
* The number of samples achieving a correct answer decreases rapidly after 10-15% of decoding steps.
* Only a small fraction of samples require more than 50% of decoding steps to achieve a correct answer.
### Interpretation
The histogram demonstrates that the decoding process is highly efficient for the majority of samples. The fact that 95.3% of samples achieve a correct answer within 25% of the decoding steps suggests that the underlying model or algorithm converges quickly. The remaining 4.7% of samples that require more than 25% of decoding steps may represent more complex or ambiguous cases. The fact that 99.2% of samples achieve a correct answer by 50% of the decoding steps indicates that the model is robust and can eventually handle even the most challenging cases. The rapid decrease in the number of samples achieving a correct answer after 10-15% of decoding steps suggests that there may be diminishing returns to further decoding steps for many samples.