\n
## Histogram: First Correct Answer Emergence
### Overview
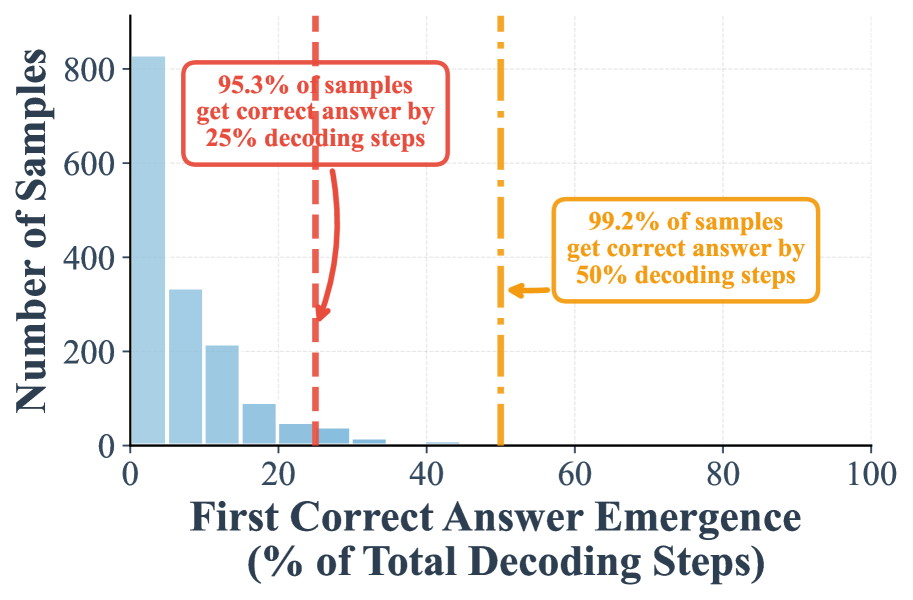
The image presents a histogram illustrating the distribution of the percentage of total decoding steps required for the first correct answer to emerge. The y-axis represents the number of samples, while the x-axis represents the percentage of total decoding steps. Two vertical lines are overlaid on the histogram, marking 25% and 50% decoding steps, with associated percentages of samples achieving a correct answer by those steps.
### Components/Axes
* **X-axis Title:** "First Correct Answer Emergence (% of Total Decoding Steps)" - Scale ranges from 0 to 100.
* **Y-axis Title:** "Number of Samples" - Scale ranges from 0 to 800.
* **Histogram Bars:** Represent the frequency distribution of the percentage of decoding steps.
* **Vertical Line 1 (Red, Dashed):** Positioned at approximately 20% on the x-axis. Associated text: "95.3% of samples get correct answer by 25% decoding steps".
* **Vertical Line 2 (Orange, Dashed):** Positioned at approximately 50% on the x-axis. Associated text: "99.2% of samples get correct answer by 50% decoding steps".
* **Annotation Box (Orange, Rounded Rectangle):** Located in the upper-right quadrant, pointing to the orange dashed line. Contains the text: "99.2% of samples get correct answer by 50% decoding steps".
* **Annotation Box (Red, Rounded Rectangle):** Located in the upper-center quadrant, pointing to the red dashed line. Contains the text: "95.3% of samples get correct answer by 25% decoding steps".
### Detailed Analysis
The histogram shows a distribution skewed towards lower percentages of decoding steps.
* **Bar Heights (Approximate):**
* 0-10%: ~350 samples
* 10-20%: ~400 samples
* 20-30%: ~80 samples
* 30-40%: ~30 samples
* 40-50%: ~10 samples
* 50-60%: ~5 samples
* 60-70%: ~2 samples
* 70-80%: ~1 sample
* 80-90%: ~0 samples
* 90-100%: ~0 samples
The distribution rapidly decreases as the percentage of decoding steps increases. The highest concentration of samples (approximately 750) required less than 20% of the total decoding steps to achieve a correct answer.
### Key Observations
* The vast majority of samples achieve a correct answer with a relatively small number of decoding steps.
* There is a steep drop-off in the number of samples requiring more than 25% decoding steps.
* The percentage of samples achieving a correct answer increases sharply between 25% and 50% decoding steps.
* Very few samples require more than 50% decoding steps.
### Interpretation
The data suggests that the decoding process is highly efficient, with most samples converging on a correct answer quickly. The two vertical lines highlight key milestones: 95.3% of samples achieve a correct answer within the first 25% of decoding steps, and this rises to 99.2% within the first 50% of decoding steps. This indicates a strong tendency for the correct answer to emerge early in the decoding process. The rapid decline in sample numbers beyond 25% suggests that the remaining samples may represent more complex or ambiguous cases that require more extensive decoding. The distribution shape implies that the decoding process is not uniformly distributed; rather, it is concentrated in the initial stages. This could be due to the nature of the problem being solved, the effectiveness of the decoding algorithm, or a combination of both.