## Line Chart: Accuracy vs. Thinking Compute
### Overview
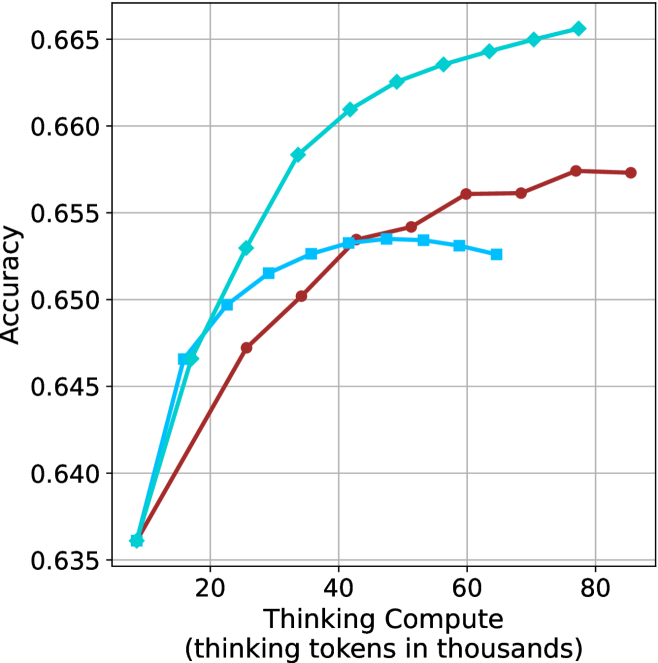
This chart illustrates the relationship between "Thinking Compute" (measured in thousands of thinking tokens) and model "Accuracy." It displays three distinct data series, each represented by a different color and marker shape. All three series originate from a common starting point at approximately 8,000 tokens and an accuracy of 0.636. The chart demonstrates how different models or configurations respond to increased computational "thinking" time.
### Components/Axes
* **Y-Axis (Vertical):** Labeled "Accuracy." The scale ranges from 0.635 to 0.665, with major grid lines at intervals of 0.005.
* **X-Axis (Horizontal):** Labeled "Thinking Compute (thinking tokens in thousands)." The scale ranges from 0 to 80+, with major grid lines at intervals of 20.
* **Legend:** **None provided.** The data series must be identified by their color and marker shape.
* **Grid:** A standard gray grid overlays the chart area.
### Detailed Analysis
There are three distinct data series. Below are the trends and approximate data points for each:
**1. Cyan Line (Diamond Markers)**
* **Trend:** This series shows the most aggressive upward slope. It demonstrates consistent improvement in accuracy as compute increases, with a slight flattening (diminishing returns) as it approaches the 80k token mark. It is the highest-performing series.
* **Approximate Data Points (x, y):**
* (8, 0.636) - Start
* (16, 0.647)
* (25, 0.653)
* (34, 0.658)
* (42, 0.661)
* (49, 0.663)
* (56, 0.664)
* (64, 0.6645)
* (71, 0.665)
* (77, 0.666)
**2. Dark Red Line (Circle Markers)**
* **Trend:** This series shows a steady, moderate upward slope. It does not reach the same peak accuracy as the Cyan series but maintains a consistent positive trajectory without significant dips.
* **Approximate Data Points (x, y):**
* (8, 0.636) - Start
* (25, 0.647)
* (34, 0.650)
* (42, 0.653)
* (52, 0.654)
* (60, 0.656)
* (68, 0.656)
* (77, 0.6575)
* (85, 0.6575)
**3. Medium Blue Line (Square Markers)**
* **Trend:** This series shows an initial upward slope similar to the others, but it peaks around 45k–50k tokens. After this peak, the accuracy plateaus and then exhibits a slight decline, suggesting a point of diminishing returns or "overthinking."
* **Approximate Data Points (x, y):**
* (8, 0.636) - Start
* (15, 0.647)
* (23, 0.650)
* (32, 0.652)
* (42, 0.653)
* (52, 0.6535)
* (60, 0.653)
* (65, 0.6525)
### Key Observations
* **Common Origin:** All three models begin with identical accuracy at the lowest compute level (~8k tokens).
* **Performance Divergence:** The models diverge significantly after ~20k tokens.
* **The "Overthinking" Phenomenon:** The Medium Blue (Square) series is the only one to show a clear performance degradation after a certain compute threshold (approx. 50k tokens), indicating that for this specific model, more thinking time eventually becomes detrimental to accuracy.
* **Superior Scaling:** The Cyan (Diamond) series is the most robust, scaling effectively across the entire range of compute provided without showing signs of performance degradation.
### Interpretation
This chart likely represents an evaluation of "test-time compute" or "Chain-of-Thought" scaling laws for different Large Language Model (LLM) configurations.
* **Efficiency vs. Capacity:** The Cyan model demonstrates the best scaling behavior, suggesting it is the most efficient or capable architecture for utilizing additional thinking tokens.
* **Diminishing Returns/Noise:** The Medium Blue model illustrates a classic "overthinking" problem. In many LLM reasoning tasks, forcing the model to generate more tokens can eventually introduce noise, hallucinations, or logical drift, which explains the downward trend after 50k tokens.
* **Stability:** The Dark Red model represents a stable, conservative scaling approach. It improves steadily but lacks the high-end performance of the Cyan model.
In a research context, this data would be used to determine the optimal "compute budget" for inference. For the Medium Blue model, one would cap the thinking tokens at 50k to avoid accuracy loss. For the Cyan model, one might continue to increase compute as long as the cost-to-accuracy ratio remains favorable.