## Scatter Plot: Statistical Parity (DSP) vs. Accuracy (AUC)
### Overview
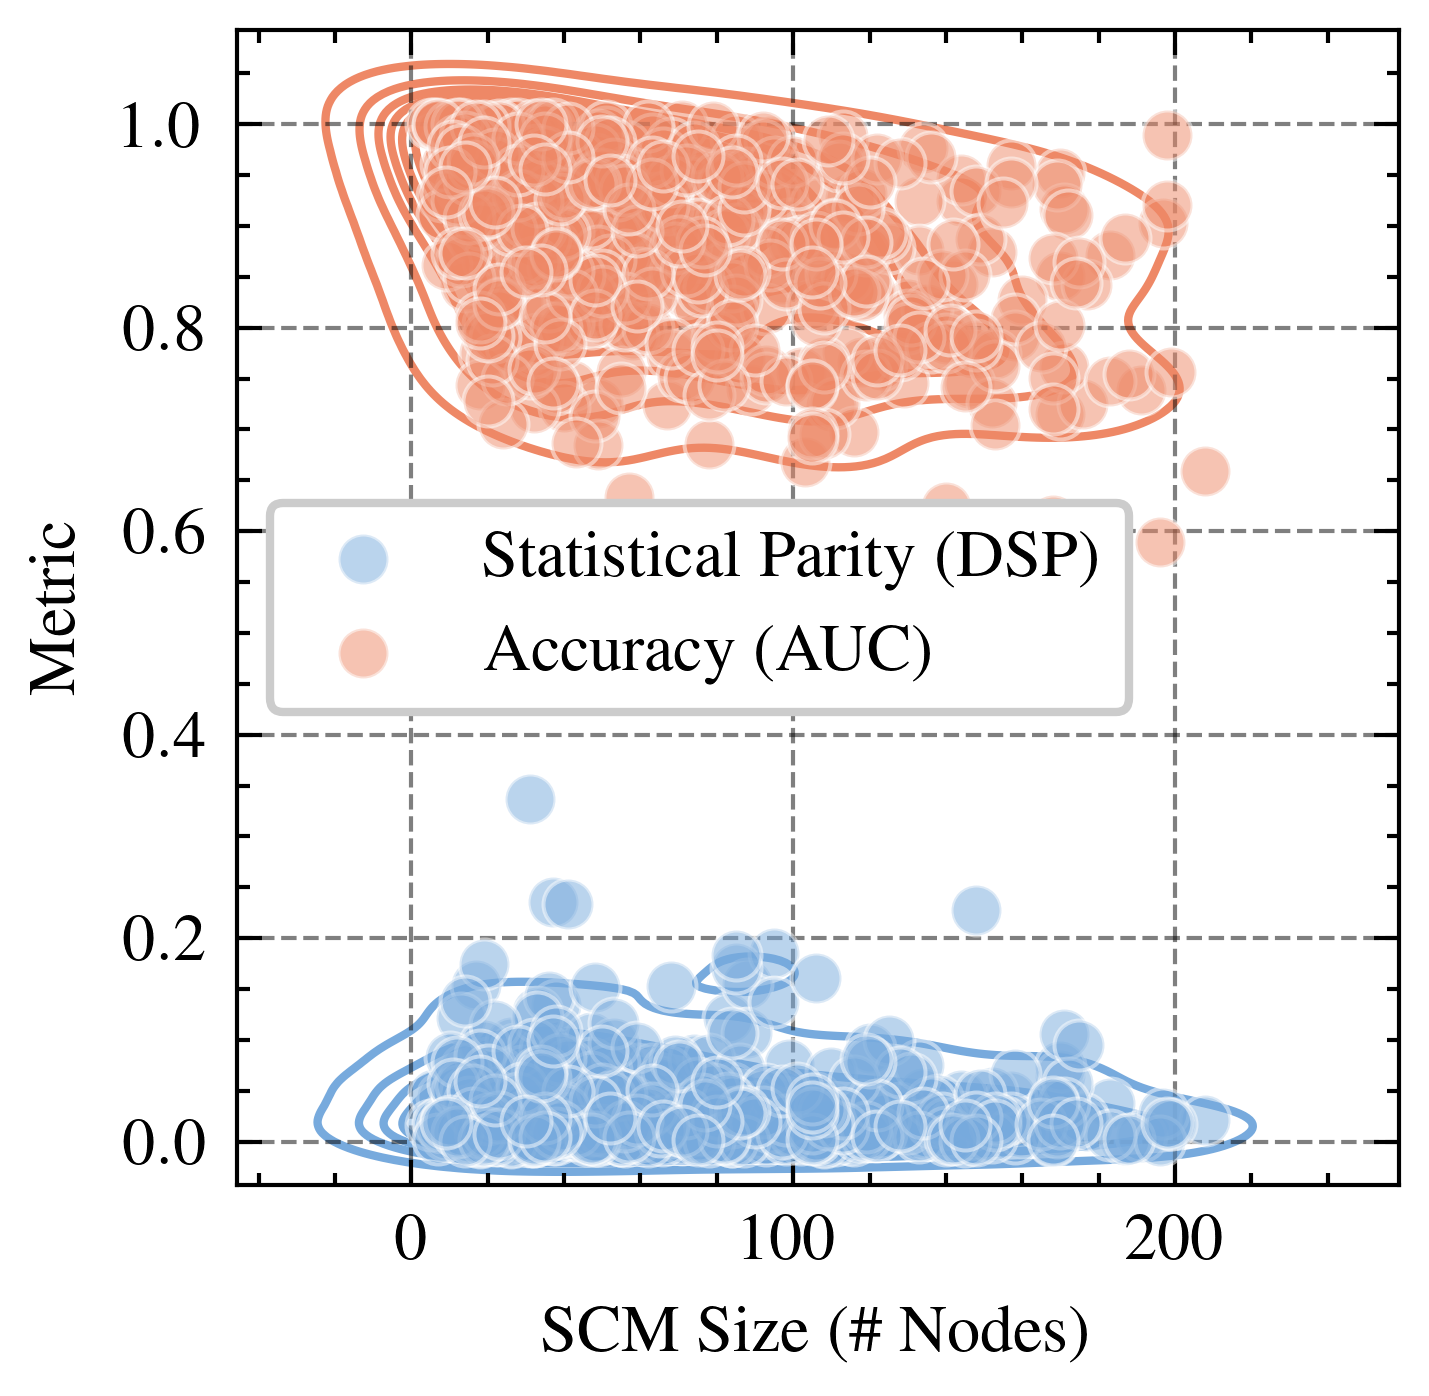
The image is a scatter plot comparing Statistical Parity (DSP) and Accuracy (AUC) against SCM Size (# Nodes). The plot displays two distinct clusters of data points, one representing Statistical Parity (DSP) in light blue and the other representing Accuracy (AUC) in light orange. Density contours are drawn around each cluster.
### Components/Axes
* **X-axis:** SCM Size (# Nodes), ranging from 0 to 200. Axis markers are present at 0, 100, and 200.
* **Y-axis:** Metric, ranging from 0.0 to 1.0. Axis markers are present at 0.0, 0.2, 0.4, 0.6, 0.8, and 1.0.
* **Legend:** Located in the center of the plot.
* Light Blue: Statistical Parity (DSP)
* Light Orange: Accuracy (AUC)
### Detailed Analysis
* **Statistical Parity (DSP) - Light Blue:**
* Trend: The light blue data points representing Statistical Parity (DSP) are clustered near the bottom of the plot, indicating low metric values.
* Data Points: The majority of the light blue points are concentrated between 0 and 200 on the X-axis (SCM Size) and between 0.0 and 0.2 on the Y-axis (Metric).
* Density Contour: The density contour surrounds the cluster of light blue points, confirming the concentration in the lower region of the plot.
* **Accuracy (AUC) - Light Orange:**
* Trend: The light orange data points representing Accuracy (AUC) are clustered near the top of the plot, indicating high metric values.
* Data Points: The majority of the light orange points are concentrated between 0 and 200 on the X-axis (SCM Size) and between 0.7 and 1.0 on the Y-axis (Metric).
* Density Contour: The density contour surrounds the cluster of light orange points, confirming the concentration in the upper region of the plot.
### Key Observations
* There are two distinct clusters, indicating a clear separation between Statistical Parity (DSP) and Accuracy (AUC) metrics.
* Statistical Parity (DSP) generally has low metric values, while Accuracy (AUC) generally has high metric values across the range of SCM Sizes.
* The SCM Size (# Nodes) does not appear to strongly influence the separation between the two metrics, as both clusters span the entire range of SCM Sizes.
### Interpretation
The scatter plot suggests that Statistical Parity (DSP) and Accuracy (AUC) are inversely related or represent different aspects of the system being measured. The clustering indicates that achieving high accuracy may come at the cost of statistical parity, and vice versa. The SCM Size (# Nodes) does not appear to be a significant factor in determining either metric, as both clusters are spread across the entire range of SCM sizes. This could imply that the size of the SCM does not directly influence the trade-off between accuracy and statistical parity. Further investigation would be needed to understand the underlying factors that drive this separation and to determine if there are specific configurations or parameters that can optimize both metrics simultaneously.