\n
## Scatter Plot: Metric vs. SCM Size
### Overview
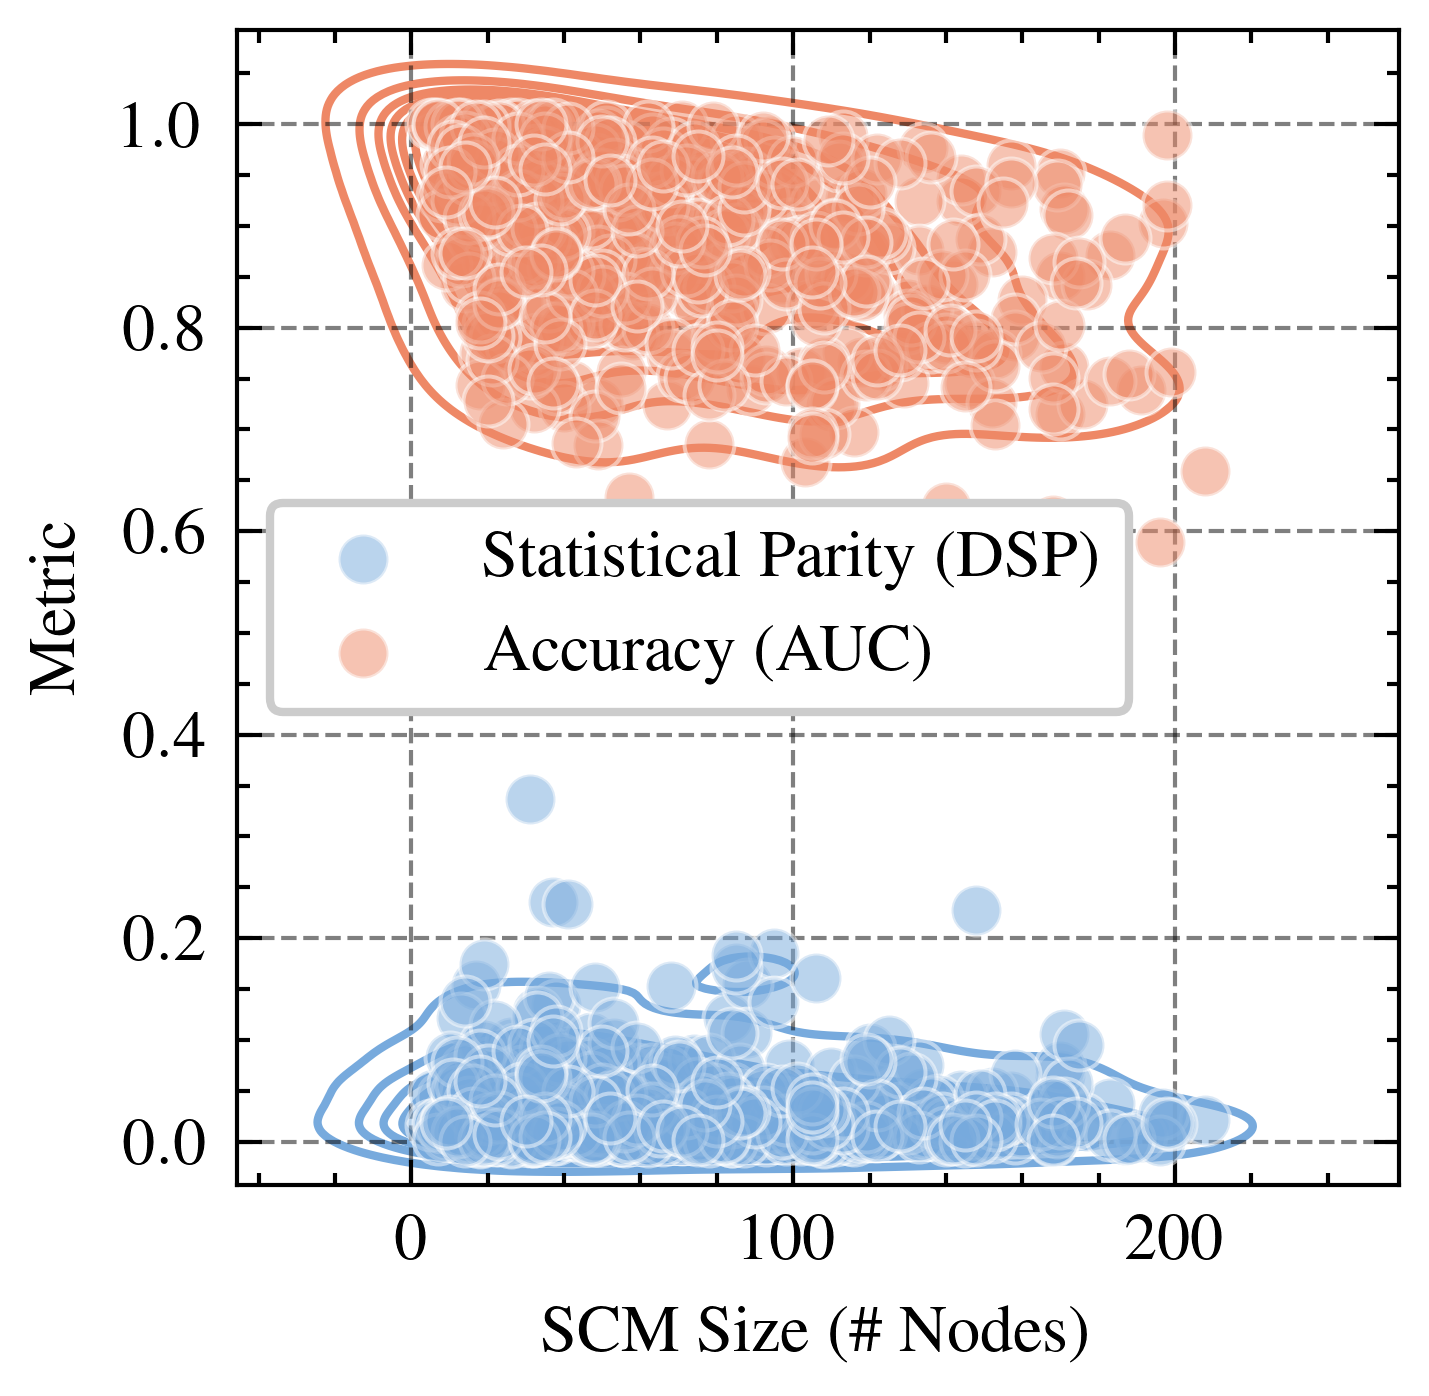
This image presents a scatter plot visualizing the relationship between "SCM Size (# Nodes)" and a "Metric" (specifically, Statistical Parity (DSP) and Accuracy (AUC)). The plot displays two distinct data series represented by differently colored scatter points.
### Components/Axes
* **X-axis:** "SCM Size (# Nodes)". Scale ranges from approximately 0 to 230.
* **Y-axis:** "Metric". Scale ranges from approximately 0 to 1.1.
* **Legend:** Located in the top-left corner.
* Blue circles: "Statistical Parity (DSP)"
* Orange circles: "Accuracy (AUC)"
* **Data Series 1:** Statistical Parity (DSP) - Represented by blue circles.
* **Data Series 2:** Accuracy (AUC) - Represented by orange circles.
* Horizontal dashed lines at Metric values of 0.0, 0.2, 0.4, 0.6, 0.8, and 1.0.
* Vertical dashed lines at SCM Size values of 0, 100, and 200.
### Detailed Analysis
**Statistical Parity (DSP) - Blue Circles:**
The blue data points cluster in the lower portion of the plot. The trend is relatively flat, with a slight upward slope initially, then leveling off.
* At SCM Size ≈ 0, the Metric (DSP) ranges from approximately 0.05 to 0.15.
* At SCM Size ≈ 50, the Metric (DSP) ranges from approximately 0.1 to 0.2.
* At SCM Size ≈ 100, the Metric (DSP) ranges from approximately 0.1 to 0.25.
* At SCM Size ≈ 200, the Metric (DSP) ranges from approximately 0.1 to 0.25.
There is a noticeable concentration of points around a Metric value of 0.15-0.2.
**Accuracy (AUC) - Orange Circles:**
The orange data points cluster in the upper portion of the plot. The trend is generally flat, maintaining a high Metric value.
* At SCM Size ≈ 0, the Metric (AUC) ranges from approximately 0.8 to 0.95.
* At SCM Size ≈ 50, the Metric (AUC) ranges from approximately 0.85 to 1.0.
* At SCM Size ≈ 100, the Metric (AUC) ranges from approximately 0.85 to 1.0.
* At SCM Size ≈ 200, the Metric (AUC) ranges from approximately 0.75 to 1.0.
There is a slight downward trend in the Metric (AUC) as the SCM Size increases, but it remains consistently high.
### Key Observations
* There is a clear separation between the two data series. Accuracy (AUC) consistently outperforms Statistical Parity (DSP) across all SCM sizes.
* Statistical Parity (DSP) remains relatively low, even with increasing SCM size.
* Accuracy (AUC) remains high, but shows a slight decrease as SCM size increases.
* The spread of the orange points is wider at higher SCM sizes, indicating more variability in accuracy.
### Interpretation
The data suggests a trade-off between accuracy and statistical parity as the size of the SCM (likely a model or system component) increases. While increasing the SCM size does not significantly improve statistical parity (and may even slightly decrease it), it maintains a high level of accuracy. The consistent high accuracy, contrasted with the low statistical parity, indicates a potential bias in the model or system. The slight decrease in accuracy at larger SCM sizes could be due to overfitting or increased complexity. The horizontal dashed lines provide a visual reference for the metric values, highlighting the significant difference between the two metrics. The vertical dashed lines help to visualize the relationship between the SCM size and the metrics at specific intervals. The plot demonstrates that achieving high accuracy does not necessarily equate to fairness (as measured by statistical parity). Further investigation is needed to understand the source of the bias and explore methods to improve statistical parity without sacrificing accuracy.