\n
## Scatter Plot: Confidence vs. Target Length (Computer Security)
### Overview
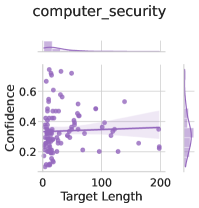
The image presents a scatter plot visualizing the relationship between "Target Length" and "Confidence" for the category "computer_security". A regression line with a shaded confidence interval is overlaid on the scatter points. A violin plot is present on the right side of the chart, showing the distribution of confidence values. A smaller violin plot is present on the top of the chart, showing the distribution of target length values.
### Components/Axes
* **Title:** "computer\_security" (top-center)
* **X-axis:** "Target Length" (bottom-center), ranging from approximately 0 to 220.
* **Y-axis:** "Confidence" (left-center), ranging from approximately 0.15 to 0.65.
* **Data Points:** Numerous purple dots representing individual data points.
* **Regression Line:** A purple line representing the trend of the data.
* **Confidence Interval:** A shaded purple area around the regression line, indicating the uncertainty in the trend.
* **Violin Plot (Right):** Displays the distribution of confidence values.
* **Violin Plot (Top):** Displays the distribution of target length values.
### Detailed Analysis
The scatter plot shows a generally flat trend between Target Length and Confidence.
* **Data Point Distribution:** The majority of data points cluster between Target Length values of 0 and 100, with Confidence values ranging from approximately 0.2 to 0.4. There are fewer data points with Target Length values exceeding 100.
* **Regression Line Trend:** The regression line is approximately horizontal, indicating a weak or non-existent linear relationship between Target Length and Confidence. The line starts at approximately Confidence = 0.38 when Target Length = 0, and ends at approximately Confidence = 0.36 when Target Length = 220.
* **Confidence Interval:** The confidence interval is relatively narrow, suggesting a moderate level of certainty in the estimated trend.
* **Violin Plot (Right):** The violin plot on the right shows a peak in the distribution of Confidence values around 0.35, with a wider spread towards lower confidence values.
* **Violin Plot (Top):** The violin plot on the top shows a peak in the distribution of Target Length values around 0, with a tail extending towards higher values.
### Key Observations
* The relationship between Target Length and Confidence appears to be weak.
* Confidence values are generally low, with most points falling below 0.4.
* There is a concentration of data points with short Target Lengths.
* The confidence interval is relatively narrow, indicating a reasonable degree of certainty in the observed trend.
### Interpretation
The data suggests that, for the "computer\_security" category, the length of the target does not strongly influence the confidence level. The confidence remains relatively stable across different target lengths. The low overall confidence values might indicate that the model or system used to generate these predictions is not highly accurate for this category. The concentration of data points with short target lengths could suggest that the system is more frequently exposed to or focused on shorter targets within the computer security domain. The violin plots confirm the general trends observed in the scatter plot, providing a visual representation of the distributions of both variables. The flat regression line suggests that any observed correlation is minimal, and other factors likely play a more significant role in determining confidence levels.