\n
## Scatter Plot: Model Performance Comparison
### Overview
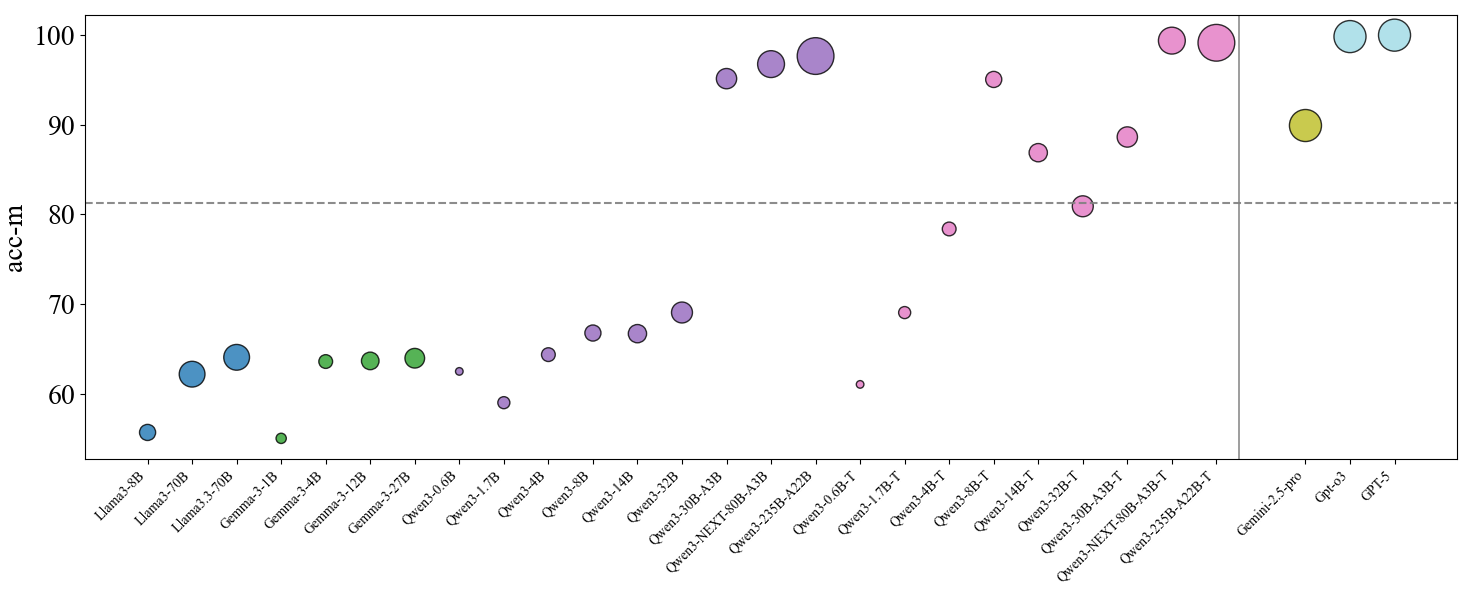
This image presents a scatter plot comparing the performance (acc-m) of various language models. The x-axis lists the model names, and the y-axis represents the accuracy metric (acc-m). Each model is represented by a colored circle, with the size of the circle potentially indicating another variable (though this is not explicitly stated in the legend). Horizontal dashed lines are present at acc-m = 80, potentially representing a performance threshold.
### Components/Axes
* **X-axis:** Model Name (Categorical) - Llama-3-8B, Llama-3-70B, Gemma-3-4B, Gemma-3-12B, Gemma-3-2B, Qwen-1.5-0.5B, Qwen-1.5-1.1B, Qwen-1.5-4B, Qwen-1.5-12B, Qwen-NEXT-60B-A1B, Qwen-2.5B-A2B, Qwen-2.5B-A2B-T, Qwen-1.5B-T, Qwen-3B-T, Qwen-4B-T, Qwen-1.5-12B-T, Qwen-NEXT-60B-A1B-T, Qwen-2.5B-pro, GPT-3, GPT-5.
* **Y-axis:** acc-m (Accuracy Metric) - Scale ranges from approximately 55 to 105.
* **Horizontal Lines:** Dashed lines at approximately acc-m = 80.
* **Data Points:** Colored circles representing individual models.
* **Legend:** No explicit legend is present, but colors are used to differentiate models.
### Detailed Analysis
The data points are scattered across the plot, showing varying levels of performance for each model. I will analyze the data points from left to right, noting approximate acc-m values.
* **Llama-3-8B:** ~63 acc-m (Blue)
* **Llama-3-70B:** ~66 acc-m (Blue)
* **Gemma-3-4B:** ~64 acc-m (Blue)
* **Gemma-3-12B:** ~66 acc-m (Blue)
* **Gemma-3-2B:** ~64 acc-m (Green)
* **Qwen-1.5-0.5B:** ~61 acc-m (Green)
* **Qwen-1.5-1.1B:** ~64 acc-m (Green)
* **Qwen-1.5-4B:** ~68 acc-m (Green)
* **Qwen-1.5-12B:** ~71 acc-m (Purple)
* **Qwen-NEXT-60B-A1B:** ~94 acc-m (Purple)
* **Qwen-2.5B-A2B:** ~83 acc-m (Pink)
* **Qwen-2.5B-A2B-T:** ~97 acc-m (Pink)
* **Qwen-1.5B-T:** ~70 acc-m (Pink)
* **Qwen-3B-T:** ~85 acc-m (Pink)
* **Qwen-4B-T:** ~88 acc-m (Yellow)
* **Qwen-1.5-12B-T:** ~84 acc-m (Yellow)
* **Qwen-NEXT-60B-A1B-T:** ~98 acc-m (Yellow)
* **Qwen-2.5B-pro:** ~95 acc-m (Blue)
* **GPT-3:** ~92 acc-m (Blue)
* **GPT-5:** ~99 acc-m (Blue)
**Trends:**
* The Llama-3 and Gemma models generally exhibit lower acc-m values compared to the Qwen and GPT models.
* Within the Qwen family, larger models (e.g., Qwen-NEXT-60B-A1B, Qwen-2.5B-A2B-T) tend to have higher acc-m values.
* The models with the suffix "-T" generally perform better than their non-"T" counterparts within the Qwen family.
* GPT-5 shows the highest acc-m value.
### Key Observations
* The Qwen-2.5B-A2B-T and Qwen-NEXT-60B-A1B-T models significantly outperform all other models, achieving acc-m values close to 100.
* The performance of Llama-3 and Gemma models is relatively consistent, with values clustering around 63-66 acc-m.
* The horizontal line at acc-m = 80 serves as a clear performance benchmark. Several models fall below this line, while others exceed it.
* The color scheme appears to be somewhat arbitrary, as there is no clear pattern relating color to model family or performance.
### Interpretation
This scatter plot demonstrates a clear correlation between model size and performance (acc-m). Larger models, particularly those from the Qwen family, generally achieve higher accuracy. The "-T" suffix likely indicates a specific training or fine-tuning process that enhances performance. The horizontal line at acc-m = 80 provides a useful threshold for evaluating model effectiveness. Models below this line may not be suitable for applications requiring high accuracy. The significant performance of Qwen-2.5B-A2B-T and Qwen-NEXT-60B-A1B-T suggests that these models represent state-of-the-art performance in this comparison. The relatively low performance of the Llama-3 and Gemma models suggests they may be less competitive in terms of accuracy, or that they were evaluated on a different task or dataset. The GPT models show strong performance, but are not necessarily the best performing. The lack of a legend makes it difficult to definitively interpret the color coding, but it appears to be used to visually group models rather than represent a specific attribute.