TECHNICAL ASSET FINGERPRINT
b8f19bd34b4c87d12e6c8656
Click to view fullscreen
Press ESC or click to close
FOUND IN PAPERS
EXPERT: healer-alpha-free VERSION 1
RUNTIME: free/openrouter/healer-alpha
INTEL_VERIFIED
\n
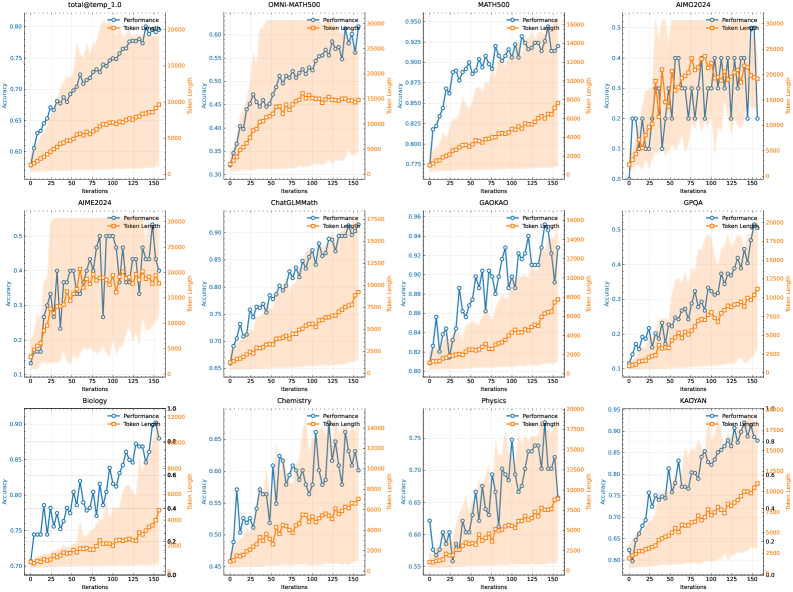
## [Multi-Chart Grid]: Performance vs. Token Length Across Datasets
### Overview
The image displays a 3x4 grid of 12 line charts. Each chart plots two metrics—"Performance" and "Token length"—against "Iterations" for a specific dataset or benchmark. The charts share a consistent visual style: a blue line with circle markers for "Performance" (left y-axis) and an orange line with square markers for "Token length" (right y-axis). A shaded orange region appears behind the "Token length" line in each plot. All charts have a legend in the top-right corner.
### Components/Axes
* **Common Elements (All Charts):**
* **X-axis Label:** `Iterations`
* **Left Y-axis Label:** `Accuracy`
* **Right Y-axis Label:** `Token length`
* **Legend:** Located in the top-right corner of each subplot. Contains two entries:
* `Performance` (Blue line, circle marker)
* `Token length` (Orange line, square marker)
* **Chart-Specific Titles and Axis Ranges:**
1. **Top-Left:** `total@temp_1.0`
* Left Y-axis: ~0.40 to 0.80
* Right Y-axis: 0 to 3000
2. **Top-Center:** `OMNI-MATH500`
* Left Y-axis: ~0.30 to 0.60
* Right Y-axis: 0 to 30000
3. **Top-Right:** `MATH500`
* Left Y-axis: ~0.775 to 0.850
* Right Y-axis: 0 to 5000
4. **Top-Far Right:** `AIMO2024`
* Left Y-axis: 0.1 to 0.5
* Right Y-axis: 0 to 30000
5. **Middle-Left:** `AIME2024`
* Left Y-axis: 0.1 to 0.5
* Right Y-axis: 0 to 30000
6. **Middle-Center:** `ChatGLM-Math`
* Left Y-axis: 0.55 to 0.80
* Right Y-axis: 0 to 17500
7. **Middle-Right:** `GAOKAO`
* Left Y-axis: 0.20 to 0.36
* Right Y-axis: 0 to 16000
8. **Middle-Far Right:** `GPQA`
* Left Y-axis: 0.1 to 0.5
* Right Y-axis: 0 to 17500
9. **Bottom-Left:** `Biology`
* Left Y-axis: 0.70 to 1.0
* Right Y-axis: 0.0 to 1.0 (Note: Right axis appears scaled differently, likely representing a normalized token length or a different unit).
10. **Bottom-Center:** `Chemistry`
* Left Y-axis: 0.45 to 0.85
* Right Y-axis: 0 to 16000
11. **Bottom-Right:** `Physics`
* Left Y-axis: 0.55 to 0.75
* Right Y-axis: 0 to 17500
12. **Bottom-Far Right:** `KA0YAN`
* Left Y-axis: 0.60 to 0.95
* Right Y-axis: 0.0 to 1.0 (Similar to Biology, right axis appears normalized).
### Detailed Analysis
**General Trend Verification:**
* **Performance (Blue Line):** In all 12 charts, the blue line shows a clear upward trend from left (iteration 0) to right (iteration ~150). The slope and volatility vary significantly between datasets.
* **Token length (Orange Line):** The orange line also shows a consistent upward trend in all charts, but its slope is generally shallower and less volatile than the Performance line.
**Chart-by-Chart Data Points (Approximate):**
* **total@temp_1.0:** Performance rises steadily from ~0.42 to ~0.78. Token length increases from ~200 to ~2200.
* **OMNI-MATH500:** Performance rises from ~0.32 to ~0.58. Token length increases from ~1000 to ~25000.
* **MATH500:** Performance rises from ~0.78 to ~0.84. Token length increases from ~500 to ~4000.
* **AIMO2024:** Performance is highly volatile, starting ~0.15, peaking near 0.5, and ending ~0.4. Token length increases from ~2000 to ~25000.
* **AIME2024:** Performance is extremely volatile, with sharp peaks and troughs between 0.15 and 0.5. Token length increases from ~2000 to ~25000.
* **ChatGLM-Math:** Performance rises smoothly from ~0.56 to ~0.79. Token length increases from ~1000 to ~16000.
* **GAOKAO:** Performance is volatile, rising from ~0.22 to ~0.34. Token length increases from ~1000 to ~15000.
* **GPQA:** Performance rises from ~0.12 to ~0.48. Token length increases from ~1000 to ~16000.
* **Biology:** Performance rises from ~0.72 to ~0.98. Token length (on normalized scale) increases from ~0.05 to ~0.8.
* **Chemistry:** Performance is volatile, rising from ~0.48 to ~0.82. Token length increases from ~1000 to ~15000.
* **Physics:** Performance rises from ~0.56 to ~0.73. Token length increases from ~1000 to ~16000.
* **KA0YAN:** Performance rises smoothly from ~0.62 to ~0.92. Token length (on normalized scale) increases from ~0.05 to ~0.8.
### Key Observations
1. **Positive Correlation:** There is a strong positive correlation between Iterations, Performance (Accuracy), and Token length across all benchmarks. As training/iterations progress, both accuracy and the length of generated tokens increase.
2. **Volatility Disparity:** The "Performance" metric exhibits significantly more volatility (sharp ups and downs) than the "Token length" metric, which grows more steadily. This is most extreme in the `AIME2024` and `AIMO2024` charts.
3. **Dataset Difficulty:** The absolute accuracy ranges suggest varying difficulty. `MATH500` and `Biology` show high baseline and final accuracy (>0.8), while `AIME2024`, `AIMO2024`, and `GPQA` show lower accuracy ranges, indicating they are more challenging benchmarks.
4. **Axis Scaling Anomaly:** The `Biology` and `KA0YAN` charts have a right y-axis (`Token length`) scaled from 0.0 to 1.0, unlike the others which use large integers. This suggests the token length data for these two subjects may have been normalized or represents a different metric (e.g., ratio).
### Interpretation
The data strongly suggests a model training or iterative refinement process where increased computational effort (Iterations) leads to both improved problem-solving ability (higher Accuracy) and the generation of longer, more detailed solutions (higher Token length). The Peircean inference is that the model is learning to "think more" or elaborate its reasoning process as it improves.
The volatility in Performance on certain math-heavy benchmarks (`AIME2024`, `AIMO2024`, `GAOKAO`) versus the smoother curves on others (`total@temp_1.0`, `ChatGLM-Math`, `KA0YAN`) may indicate that progress on highly complex, multi-step reasoning problems is less linear and more prone to plateaus or regressions during training, even as the model consistently produces longer outputs.
The consistent lag of the Token length curve behind the Performance curve in the early iterations (visible as the orange line starting below the blue line's relative position) could imply that the model first learns to solve problems more correctly with concise answers, and only later learns to elaborate. Alternatively, it may simply reflect that the token count is a cumulative or slower-changing metric.
The anomaly in the `Biology` and `KA0YAN` right-axis scaling is critical. If normalized, it indicates that token length growth for these subjects is being measured relative to a maximum, showing they approach a saturation point (~0.8 of max length) as performance nears perfection (~0.98 accuracy). This contrasts with other subjects where token length appears to grow without such a clear bound within the observed iteration window.
DECODING INTELLIGENCE...