## Bar Chart: Best-of-8 Mean Accuracy Comparison
### Overview
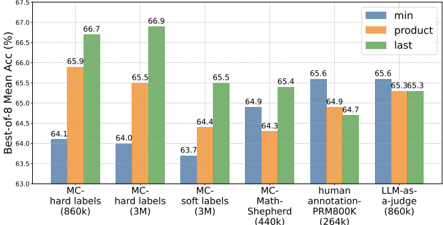
This image displays a grouped bar chart comparing the "Best-of-8 Mean Acc (%)" across six distinct training or evaluation methodologies. Each category is represented by three bars corresponding to three different metrics: "min" (blue), "product" (orange), and "last" (green). The chart illustrates how accuracy varies across these metrics for different datasets and labeling techniques.
### Components/Axes
* **Y-Axis**: Labeled "Best-of-8 Mean Acc (%)". The scale ranges from 63.0 to 67.5, with grid lines at 0.5 intervals.
* **X-Axis**: Contains six categorical labels representing different methods:
1. MC-hard labels (860k)
2. MC-hard labels (3M)
3. MC-soft labels (3M)
4. MC-Math-Shepherd (440k)
5. human annotation-PRM800K (264k)
6. LLM-as-a-judge (860k)
* **Legend**: Located in the top-right corner.
* **Blue bar**: "min"
* **Orange bar**: "product"
* **Green bar**: "last"
### Detailed Analysis
The following data points are extracted from the chart, organized by category. The trend for each series is noted based on the progression from "min" (blue) to "product" (orange) to "last" (green).
| Category | min (Blue) | product (Orange) | last (Green) | Trend |
| :--- | :--- | :--- | :--- | :--- |
| **MC-hard labels (860k)** | 64.1 | 65.9 | 66.7 | Upward |
| **MC-hard labels (3M)** | 64.0 | 65.5 | 66.9 | Upward |
| **MC-soft labels (3M)** | 63.7 | 64.4 | 65.5 | Upward |
| **MC-Math-Shepherd (440k)** | 64.9 | 64.3 | 65.4 | Fluctuating (Down then Up) |
| **human annotation-PRM800K (264k)** | 65.6 | 64.9 | 64.7 | Downward |
| **LLM-as-a-judge (860k)** | 65.6 | 65.3 | 65.3 | Slightly Downward/Flat |
### Key Observations
* **Divergent Trends**: There is a clear split in behavior between the "MC" (Multiple Choice) methods and the "human/LLM" methods. The MC methods generally show an upward trend (improving from min to last), whereas the human annotation and LLM-as-a-judge methods show a downward or flat trend (starting higher at min).
* **Highest Performance**: The "MC-hard labels (3M)" category achieves the highest overall value in the "last" metric (66.9).
* **Lowest Performance**: The "MC-soft labels (3M)" category starts with the lowest "min" value (63.7).
* **Consistency**: The "LLM-as-a-judge" method shows the most stability between the "product" and "last" metrics, both being 65.3.
### Interpretation
The data suggests a fundamental difference in how these training/evaluation methods behave over time or across different aggregation strategies.
1. **MC Methods (Hard/Soft Labels)**: These methods appear to benefit from the "last" metric, suggesting that the model's performance improves as the training or sampling process progresses. The "hard labels" approach, regardless of dataset size (860k vs 3M), consistently yields higher accuracy than the "soft labels" approach.
2. **Human/LLM Methods**: Conversely, the "human annotation" and "LLM-as-a-judge" methods perform best at the "min" stage. This could imply that later stages of these specific processes might be introducing noise or overfitting, or that the initial state is the most robust.
3. **Methodological Implications**: If the goal is to maximize the "Best-of-8 Mean Acc," the "MC-hard labels" approach is superior to the others presented. The "human annotation" and "LLM-as-a-judge" methods, while starting strong, do not scale their performance in the same way as the MC methods, suggesting they may be less effective for this specific metric as the process continues.