## Bar Chart: MetaQA 1-Hop Hit@1 Scores
### Overview
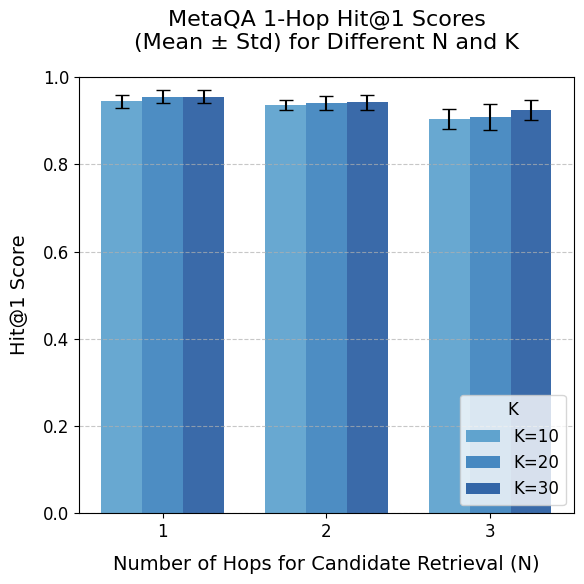
The image is a bar chart comparing MetaQA 1-Hop Hit@1 scores (Mean ± Std) for different values of N (Number of Hops for Candidate Retrieval) and K. The chart displays the Hit@1 score on the y-axis against the number of hops (N) on the x-axis, with bars grouped by N and colored according to the value of K (10, 20, and 30). Error bars representing the standard deviation are shown on top of each bar.
### Components/Axes
* **Title:** MetaQA 1-Hop Hit@1 Scores (Mean ± Std) for Different N and K
* **X-axis:** Number of Hops for Candidate Retrieval (N)
* Values: 1, 2, 3
* **Y-axis:** Hit@1 Score
* Scale: 0.0 to 1.0, with increments of 0.2
* **Legend:** Located in the bottom-right corner.
* K=10 (light blue)
* K=20 (medium blue)
* K=30 (dark blue)
### Detailed Analysis
The chart presents Hit@1 scores for different combinations of N and K. Each group of bars represents a value of N (1, 2, or 3), and within each group, the bars represent K=10, K=20, and K=30, respectively.
* **N=1:**
* K=10 (light blue): Hit@1 score ≈ 0.94 ± 0.02
* K=20 (medium blue): Hit@1 score ≈ 0.96 ± 0.02
* K=30 (dark blue): Hit@1 score ≈ 0.96 ± 0.02
* **N=2:**
* K=10 (light blue): Hit@1 score ≈ 0.93 ± 0.02
* K=20 (medium blue): Hit@1 score ≈ 0.94 ± 0.02
* K=30 (dark blue): Hit@1 score ≈ 0.95 ± 0.02
* **N=3:**
* K=10 (light blue): Hit@1 score ≈ 0.90 ± 0.02
* K=20 (medium blue): Hit@1 score ≈ 0.91 ± 0.02
* K=30 (dark blue): Hit@1 score ≈ 0.93 ± 0.02
### Key Observations
* The Hit@1 scores are generally high, ranging from approximately 0.90 to 0.96.
* The Hit@1 score tends to decrease slightly as the number of hops (N) increases.
* For each value of N, the Hit@1 score tends to increase slightly as K increases from 10 to 30.
* The standard deviation (error bars) is relatively small, indicating consistent performance.
### Interpretation
The data suggests that the MetaQA model performs well in the 1-Hop setting, achieving high Hit@1 scores across different values of N and K. Increasing the number of hops (N) appears to have a slightly negative impact on performance, while increasing K tends to improve the Hit@1 score marginally. The small standard deviations indicate that the model's performance is stable and reliable. The model performs best when N is low (1 or 2) and K is high (30).