\n
## Bar Chart: MetaQA 1-Hop Hit@1 Scores
### Overview
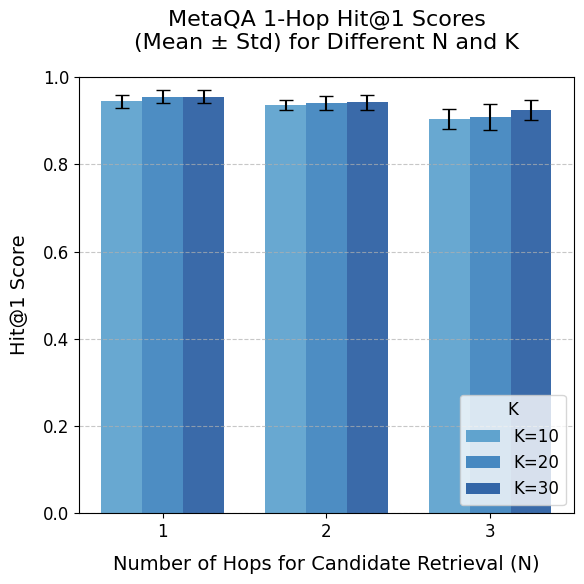
This bar chart displays the Mean ± Standard Deviation of Hit@1 scores for the MetaQA dataset, varying the number of hops (N) for candidate retrieval and the value of K. The chart compares performance across three different values of K (10, 20, and 30) for each hop value (1, 2, and 3).
### Components/Axes
* **Title:** "MetaQA 1-Hop Hit@1 Scores (Mean ± Std) for Different N and K" - positioned at the top-center of the chart.
* **X-axis:** "Number of Hops for Candidate Retrieval (N)" - labeled with values 1, 2, and 3.
* **Y-axis:** "Hit@1 Score" - scaled from 0.0 to 1.0 with increments of 0.2.
* **Legend:** Located in the top-right corner, identifying the different values of K:
* K=10 (Light Blue)
* K=20 (Medium Blue)
* K=30 (Dark Blue)
* **Error Bars:** Represent the standard deviation for each data point.
### Detailed Analysis
The chart consists of three groups of bars, one for each value of N (1, 2, and 3). Within each group, there are three bars representing the Hit@1 scores for K=10, K=20, and K=30.
* **N=1:**
* K=10: The bar reaches approximately 0.92 ± 0.01.
* K=20: The bar reaches approximately 0.94 ± 0.01.
* K=30: The bar reaches approximately 0.93 ± 0.01.
* **N=2:**
* K=10: The bar reaches approximately 0.91 ± 0.01.
* K=20: The bar reaches approximately 0.93 ± 0.01.
* K=30: The bar reaches approximately 0.92 ± 0.01.
* **N=3:**
* K=10: The bar reaches approximately 0.89 ± 0.01.
* K=20: The bar reaches approximately 0.92 ± 0.01.
* K=30: The bar reaches approximately 0.91 ± 0.01.
The error bars are consistently small, indicating low variance in the scores.
### Key Observations
* The Hit@1 scores are generally high across all conditions, consistently above 0.85.
* The highest scores are achieved when N=1 and K=20, with a score of approximately 0.94.
* As the number of hops (N) increases, the Hit@1 scores tend to slightly decrease, although the differences are small.
* The difference in performance between different values of K is minimal.
### Interpretation
The data suggests that the MetaQA model performs well in retrieving the correct answer within one hop (N=1). Increasing the number of hops (N) does not significantly improve performance and may even lead to a slight decrease in Hit@1 scores. The value of K (number of candidates retrieved) has a relatively small impact on performance, with K=20 yielding the highest scores in this dataset. The consistently low standard deviation indicates that the results are reliable and not heavily influenced by random variations. This implies that the model is robust and consistently finds the correct answer when limited to a single hop. The slight decrease in performance with increasing hops suggests that the model may struggle to identify relevant information beyond the immediate context.