## Bar Chart: CoT with 30 steps, TV 0.272
### Overview
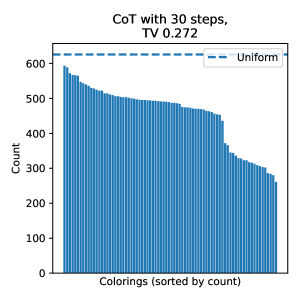
The image is a bar chart displaying the distribution of "Colorings" sorted by count, with a total variation (TV) value of 0.272. The chart includes a dashed blue "Uniform" reference line at approximately 600 on the y-axis. The bars represent counts of colorings, decreasing from left to right.
### Components/Axes
- **Title**: "CoT with 30 steps, TV 0.272"
- **Y-axis**: "Count" (ranging from 0 to 600 in increments of 100).
- **X-axis**: "Colorings (sorted by count)" (no explicit numerical labels, but bars are ordered by descending count).
- **Legend**: A dashed blue line labeled "Uniform" positioned at the top of the chart.
- **TV Value**: "0.272" embedded in the title, likely representing total variation.
### Detailed Analysis
- **Bars**:
- The bars are blue, with heights decreasing from left to right.
- The first bar (leftmost) reaches approximately **600** (matching the "Uniform" line).
- Subsequent bars show a gradual decline, with the last bar (rightmost) reaching approximately **250**.
- The drop in counts is most pronounced between the 10th and 20th bars, where the count falls from ~400 to ~300.
- **Uniform Line**:
- A horizontal dashed blue line at **600** on the y-axis, labeled "Uniform."
- The first bar aligns with this line, suggesting a reference for maximum count.
- **TV Value**:
- "0.272" is part of the title, likely indicating total variation. A low TV value (close to 0) typically implies near-uniformity, but the visual trend shows a clear decline in counts.
### Key Observations
1. **Initial Uniformity**: The first bar matches the "Uniform" line, suggesting some colorings have counts near the reference value.
2. **Declining Counts**: The majority of bars show a steady decline, with the last bar at ~250, indicating a long tail of lower-count colorings.
3. **TV vs. Visual Trend**: The TV value (0.272) suggests moderate deviation from uniformity, but the visual shows a significant drop in counts, which may indicate a non-uniform distribution.
### Interpretation
- The chart illustrates a distribution of colorings where the majority have counts below the "Uniform" reference line (600). The TV value of 0.272 implies some deviation from uniformity, but the visual trend highlights a clear decline in counts, suggesting that while some colorings are highly frequent, others are less so.
- The "Uniform" line may represent an expected or ideal distribution, but the actual data shows a non-uniform pattern. This could indicate that the "CoT with 30 steps" process generates a skewed distribution of colorings, with a concentration of high-count colorings at the start and a gradual tapering toward lower counts.
- The TV value might reflect the total variation in the distribution, but the visual discrepancy suggests further investigation into how TV is calculated (e.g., whether it accounts for the entire range or specific segments).
### Spatial Grounding
- **Legend**: Top-right corner, aligned with the "Uniform" line.
- **Bars**: Left-aligned, decreasing in height from left to right.
- **TV Value**: Embedded in the title, centered.
### Content Details
- **Count Values**:
- First bar: ~600 (matches "Uniform" line).
- Last bar: ~250.
- Intermediate bars: Gradual decline from ~600 to ~250.
- **TV Value**: 0.272 (likely a metric for distribution uniformity).
### Notable Anomalies
- The first bar aligns with the "Uniform" line, but subsequent bars deviate significantly, suggesting the distribution is not truly uniform.
- The TV value (0.272) may not fully capture the visual trend, indicating potential limitations in the metric or its interpretation.