\n
## Bar Chart: Performance Comparison of Different Similarity Metrics
### Overview
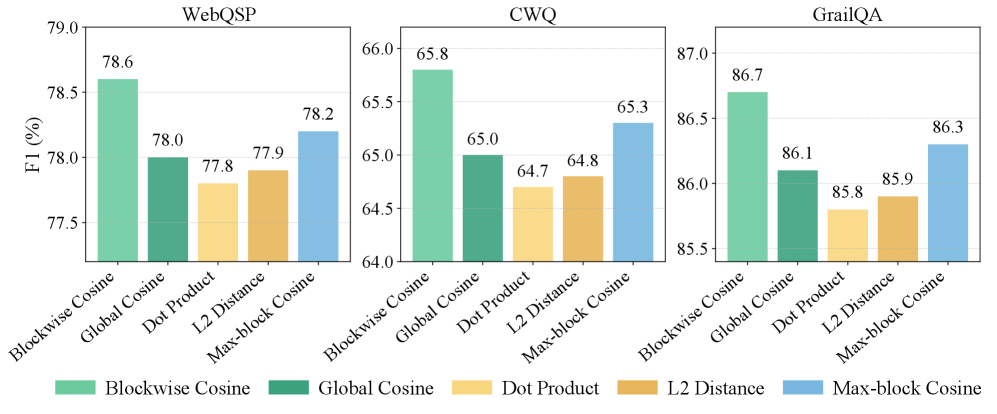
This image presents a comparative bar chart illustrating the F1 scores (%) achieved by four different similarity metrics – Blockwise Cosine, Global Cosine, Dot Product, L2 Distance, and Max-block Cosine – across three distinct datasets: WebQSP, CWQ, and GrailQA. Each dataset has its own set of bars representing the performance of each metric.
### Components/Axes
* **X-axis:** Represents the similarity metrics: Blockwise Cosine, Global Cosine, Dot Product, L2 Distance, and Max-block Cosine.
* **Y-axis:** Represents the F1 score in percentage (%). The scale ranges from approximately 64.0 to 87.0.
* **Datasets:** Three datasets are compared: WebQSP, CWQ, and GrailQA, each displayed as a separate set of bars.
* **Legend:** Located at the bottom of the image, it maps colors to the similarity metrics:
* Blockwise Cosine: Light Green
* Global Cosine: Dark Green
* Dot Product: Orange
* L2 Distance: Light Blue
* Max-block Cosine: Dark Blue
### Detailed Analysis
**WebQSP (Leftmost Chart)**
* **Blockwise Cosine:** The bar is light green and reaches approximately 78.6%.
* **Global Cosine:** The bar is dark green and reaches approximately 78.0%.
* **Dot Product:** The bar is orange and reaches approximately 77.8%.
* **L2 Distance:** The bar is light blue and reaches approximately 77.9%.
* **Max-block Cosine:** The bar is dark blue and reaches approximately 78.2%.
**CWQ (Center Chart)**
* **Blockwise Cosine:** The bar is light green and reaches approximately 65.8%.
* **Global Cosine:** The bar is dark green and reaches approximately 65.0%.
* **Dot Product:** The bar is orange and reaches approximately 64.7%.
* **L2 Distance:** The bar is light blue and reaches approximately 64.8%.
* **Max-block Cosine:** The bar is dark blue and reaches approximately 65.3%.
**GrailQA (Rightmost Chart)**
* **Blockwise Cosine:** The bar is light green and reaches approximately 86.7%.
* **Global Cosine:** The bar is dark green and reaches approximately 86.1%.
* **Dot Product:** The bar is orange and reaches approximately 85.8%.
* **L2 Distance:** The bar is light blue and reaches approximately 85.9%.
* **Max-block Cosine:** The bar is dark blue and reaches approximately 86.3%.
### Key Observations
* Blockwise Cosine consistently performs well across all three datasets, often achieving the highest F1 scores.
* L2 Distance generally exhibits the lowest performance among the metrics.
* The performance differences between metrics are more pronounced in the GrailQA dataset compared to WebQSP and CWQ.
* The F1 scores are generally higher for WebQSP and GrailQA than for CWQ.
### Interpretation
The data suggests that Blockwise Cosine is the most effective similarity metric for these datasets and tasks, consistently outperforming the other methods. The lower performance of L2 Distance indicates it may not be well-suited for capturing the relevant semantic relationships within these datasets. The higher scores on WebQSP and GrailQA compared to CWQ suggest that the characteristics of CWQ (perhaps its complexity or the nature of the questions) make it more challenging for all the similarity metrics. The relatively small differences in performance between Global Cosine, Dot Product, and Max-block Cosine suggest they offer comparable results, and the choice between them might depend on computational cost or other factors. The consistent ranking of these metrics across datasets indicates a degree of robustness in their relative performance. The visual representation effectively highlights these trends, allowing for a quick and clear comparison of the metrics' effectiveness.