## Chart: Llama Model Performance Comparison
### Overview
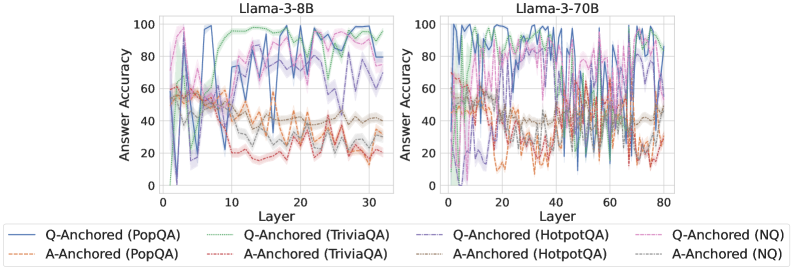
The image presents two line charts comparing the answer accuracy of Llama-3 models (8B and 70B parameters) across different layers. The charts depict the performance of the models on various question-answering datasets, with separate lines for question-anchored (Q-Anchored) and answer-anchored (A-Anchored) approaches. The x-axis represents the layer number, and the y-axis represents the answer accuracy in percentage.
### Components/Axes
* **Chart Titles:**
* Left Chart: Llama-3-8B
* Right Chart: Llama-3-70B
* **X-Axis:**
* Label: Layer
* Left Chart Scale: 0 to 30, with ticks at intervals of 5.
* Right Chart Scale: 0 to 80, with ticks at intervals of 20.
* **Y-Axis:**
* Label: Answer Accuracy
* Scale: 0 to 100, with ticks at intervals of 20.
* **Legend:** Located at the bottom of the image, applies to both charts.
* Blue solid line: Q-Anchored (PopQA)
* Brown dashed line: A-Anchored (PopQA)
* Green dotted line: Q-Anchored (TriviaQA)
* Orange dash-dot line: A-Anchored (TriviaQA)
* Purple dash-dash line: Q-Anchored (HotpotQA)
* Gray dotted line: A-Anchored (HotpotQA)
* Pink dash-dot-dot line: Q-Anchored (NQ)
* Dark Gray dash-dash-dash line: A-Anchored (NQ)
### Detailed Analysis
#### Llama-3-8B (Left Chart)
* **Q-Anchored (PopQA) (Blue solid line):** Starts around 60% accuracy, drops sharply to near 0% around layer 2, then rises sharply to around 80% by layer 5, and fluctuates between 70% and 90% for the remaining layers.
* **A-Anchored (PopQA) (Brown dashed line):** Starts around 60% accuracy, decreases to around 40% by layer 5, and then fluctuates between 40% and 50% for the remaining layers.
* **Q-Anchored (TriviaQA) (Green dotted line):** Starts around 60% accuracy, rises sharply to around 100% by layer 10, and then fluctuates between 80% and 100% for the remaining layers.
* **A-Anchored (TriviaQA) (Orange dash-dot line):** Starts around 60% accuracy, decreases to around 40% by layer 5, and then fluctuates between 20% and 40% for the remaining layers.
* **Q-Anchored (HotpotQA) (Purple dash-dash line):** Starts around 60% accuracy, fluctuates between 60% and 90% for the entire range of layers.
* **A-Anchored (HotpotQA) (Gray dotted line):** Starts around 60% accuracy, decreases to around 40% by layer 5, and then fluctuates between 30% and 40% for the remaining layers.
* **Q-Anchored (NQ) (Pink dash-dot-dot line):** Starts around 60% accuracy, fluctuates between 60% and 80% for the entire range of layers.
* **A-Anchored (NQ) (Dark Gray dash-dash-dash line):** Starts around 60% accuracy, decreases to around 40% by layer 5, and then fluctuates between 20% and 40% for the remaining layers.
#### Llama-3-70B (Right Chart)
* **Q-Anchored (PopQA) (Blue solid line):** Starts around 60% accuracy, rises sharply to around 100% by layer 10, and then fluctuates between 80% and 100% for the remaining layers.
* **A-Anchored (PopQA) (Brown dashed line):** Starts around 60% accuracy, decreases to around 20% by layer 10, and then fluctuates between 20% and 40% for the remaining layers.
* **Q-Anchored (TriviaQA) (Green dotted line):** Starts around 60% accuracy, rises sharply to around 100% by layer 10, and then fluctuates between 80% and 100% for the remaining layers.
* **A-Anchored (TriviaQA) (Orange dash-dot line):** Starts around 60% accuracy, decreases to around 20% by layer 10, and then fluctuates between 20% and 40% for the remaining layers.
* **Q-Anchored (HotpotQA) (Purple dash-dash line):** Starts around 60% accuracy, fluctuates between 60% and 90% for the entire range of layers.
* **A-Anchored (HotpotQA) (Gray dotted line):** Starts around 60% accuracy, decreases to around 40% by layer 10, and then fluctuates between 30% and 40% for the remaining layers.
* **Q-Anchored (NQ) (Pink dash-dot-dot line):** Starts around 60% accuracy, fluctuates between 60% and 80% for the entire range of layers.
* **A-Anchored (NQ) (Dark Gray dash-dash-dash line):** Starts around 60% accuracy, decreases to around 40% by layer 10, and then fluctuates between 20% and 40% for the remaining layers.
### Key Observations
* For both models, Q-Anchored approaches generally outperform A-Anchored approaches.
* The TriviaQA dataset shows the highest accuracy for Q-Anchored approaches in both models.
* The 70B model generally achieves higher and more stable accuracy compared to the 8B model, especially for Q-Anchored (PopQA) and Q-Anchored (TriviaQA).
* A-Anchored approaches show relatively low and unstable accuracy across all datasets and both models.
### Interpretation
The data suggests that question-anchoring is a more effective strategy than answer-anchoring for these Llama-3 models on the tested question-answering datasets. The larger 70B model demonstrates improved performance and stability compared to the 8B model, indicating that model size contributes to better accuracy. The consistent high performance on TriviaQA suggests that the models are particularly well-suited for this type of question-answering task. The relatively poor performance of A-Anchored approaches may indicate a weakness in the model's ability to leverage answer-specific information effectively.