## Scatter Plot: Performance Over Time by Precision
### Overview
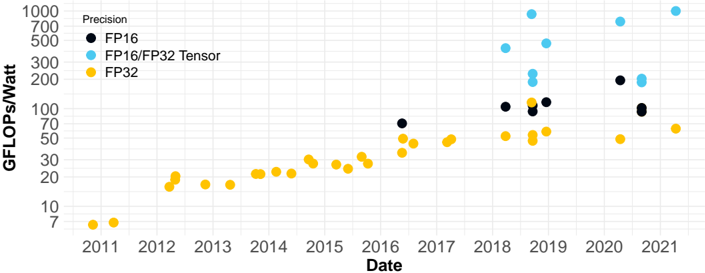
This image presents a scatter plot illustrating the performance (GFLOPS/Watt) of computing hardware over time (2011-2021) for different precision levels: FP16, FP16/FP32 Tensor, and FP32. The plot shows how performance has evolved for each precision type over the decade.
### Components/Axes
* **X-axis:** Date, ranging from 2011 to 2021. The axis is labeled "Date".
* **Y-axis:** GFLOPS/Watt, ranging from 0 to 1000. The axis is labeled "GFLOPS/Watt".
* **Legend:** Located in the top-left corner, defining the color-coding for each precision type:
* Black: FP16
* Light Blue: FP16/FP32 Tensor
* Yellow: FP32
### Detailed Analysis
The plot contains data points for each precision type across the specified date range.
**FP32 (Yellow):**
The FP32 data series shows a generally upward trend, starting at approximately 5 GFLOPS/Watt in 2011 and reaching around 70 GFLOPS/Watt by 2021. There is some fluctuation, but the overall trend is positive.
* 2011: ~5 GFLOPS/Watt
* 2012: ~15 GFLOPS/Watt
* 2013: ~20 GFLOPS/Watt
* 2014: ~25 GFLOPS/Watt
* 2015: ~30 GFLOPS/Watt
* 2016: ~40 GFLOPS/Watt
* 2017: ~45 GFLOPS/Watt
* 2018: ~50 GFLOPS/Watt
* 2019: ~60 GFLOPS/Watt
* 2020: ~65 GFLOPS/Watt
* 2021: ~70 GFLOPS/Watt
**FP16/FP32 Tensor (Light Blue):**
This series exhibits the most significant performance gains. It starts at a lower value than FP32 around 2018, but quickly surpasses it.
* 2018: ~100 GFLOPS/Watt
* 2019: ~500 GFLOPS/Watt
* 2020: ~700 GFLOPS/Watt
* 2021: ~600 GFLOPS/Watt
**FP16 (Black):**
The FP16 data series appears later in the timeline, starting around 2016. It shows a more erratic pattern, with some significant jumps in performance.
* 2016: ~75 GFLOPS/Watt
* 2017: ~100 GFLOPS/Watt
* 2018: ~100 GFLOPS/Watt
* 2019: ~80 GFLOPS/Watt
* 2020: ~200 GFLOPS/Watt
* 2021: ~80 GFLOPS/Watt
### Key Observations
* FP16/FP32 Tensor precision demonstrates the most substantial performance improvement over the decade, significantly outpacing FP32 and FP16.
* FP32 shows a steady, but less dramatic, increase in performance.
* FP16 performance is variable, with a large jump in 2020, followed by a decrease in 2021.
* The data suggests a trend towards higher performance with lower precision (FP16/FP32 Tensor).
### Interpretation
The data illustrates the evolution of computing performance across different precision levels. The dominance of FP16/FP32 Tensor in recent years suggests a shift towards utilizing these precision levels for improved efficiency and performance, likely driven by the demands of machine learning and AI workloads. The relatively stable growth of FP32 indicates its continued relevance, while the fluctuating performance of FP16 might be due to variations in hardware implementations or specific application optimizations. The plot highlights the trade-offs between precision and performance, and how advancements in hardware and software are enabling higher performance at lower precision levels. The decrease in FP16 performance in 2021 could indicate a temporary setback or a change in focus for hardware manufacturers.