## Line Chart: Accuracy on Ir&It (%) vs. # Iterations
### Overview
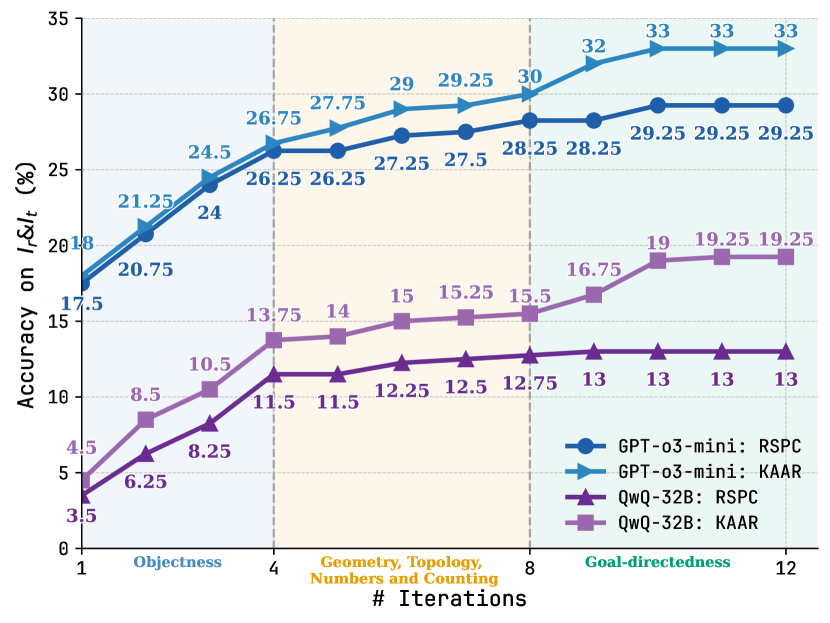
The image is a line chart comparing the accuracy of two models, GPT-o3-mini and QwQ-32B, on different tasks (RSPC and KAAR) across varying numbers of iterations. The x-axis represents the number of iterations, while the y-axis represents the accuracy percentage. The chart is divided into three sections representing different task categories: Objectness, Geometry/Topology/Numbers and Counting, and Goal-directedness.
### Components/Axes
* **Title:** Accuracy on Ir&It (%)
* **X-axis:** # Iterations, with labels 1, 4, 8, and 12. The x-axis is divided into three sections:
* Objectness (between 1 and 4)
* Geometry, Topology, Numbers and Counting (between 4 and 8)
* Goal-directedness (between 8 and 12)
* **Y-axis:** Accuracy on Ir&It (%), with a scale from 0 to 35, incrementing by 5.
* **Legend:** Located in the bottom-right corner.
* **Blue with Circle:** GPT-o3-mini: RSPC
* **Light Blue with Triangle:** GPT-o3-mini: KAAR
* **Purple with Triangle:** QwQ-32B: RSPC
* **Light Purple with Square:** QwQ-32B: KAAR
### Detailed Analysis
* **GPT-o3-mini: RSPC (Blue with Circle):**
* Trend: Generally increasing, plateaus after 8 iterations.
* Data Points:
* Iteration 1: 17.5%
* Iteration 2: 20.75%
* Iteration 4: 26.25%
* Iteration 6: 27.5%
* Iteration 8: 28.25%
* Iteration 10: 29.25%
* Iteration 12: 29.25%
* **GPT-o3-mini: KAAR (Light Blue with Triangle):**
* Trend: Increasing, plateaus after 8 iterations.
* Data Points:
* Iteration 1: 18%
* Iteration 2: 21.25%
* Iteration 4: 26.75%
* Iteration 6: 29.25%
* Iteration 8: 30%
* Iteration 10: 32%
* Iteration 12: 33%
* **QwQ-32B: RSPC (Purple with Triangle):**
* Trend: Increases initially, then plateaus after 4 iterations.
* Data Points:
* Iteration 1: 3.5%
* Iteration 2: 6.25%
* Iteration 4: 11.5%
* Iteration 6: 12.5%
* Iteration 8: 12.75%
* Iteration 10: 13%
* Iteration 12: 13%
* **QwQ-32B: KAAR (Light Purple with Square):**
* Trend: Increasing, plateaus after 8 iterations.
* Data Points:
* Iteration 1: 4.5%
* Iteration 2: 8.5%
* Iteration 4: 13.75%
* Iteration 6: 15.25%
* Iteration 8: 15.5%
* Iteration 10: 19%
* Iteration 12: 19.25%
### Key Observations
* GPT-o3-mini models (both RSPC and KAAR) consistently outperform QwQ-32B models across all iterations and task categories.
* The accuracy of all models tends to plateau after 8 iterations.
* The "Objectness" task category (iterations 1-4) shows a steeper initial increase in accuracy for all models compared to the other categories.
* The KAAR task generally yields higher accuracy than the RSPC task for both models.
### Interpretation
The data suggests that the GPT-o3-mini architecture is more effective than the QwQ-32B architecture for the given tasks. The plateauing of accuracy after 8 iterations indicates a point of diminishing returns, suggesting that further iterations may not significantly improve performance. The difference in performance between RSPC and KAAR tasks could be attributed to the inherent complexity or nature of these tasks. The initial rapid increase in accuracy during the "Objectness" phase may indicate that this task is relatively easier for the models to learn initially.