# Technical Document Extraction: Accuracy vs. Iterations Chart
## Chart Overview
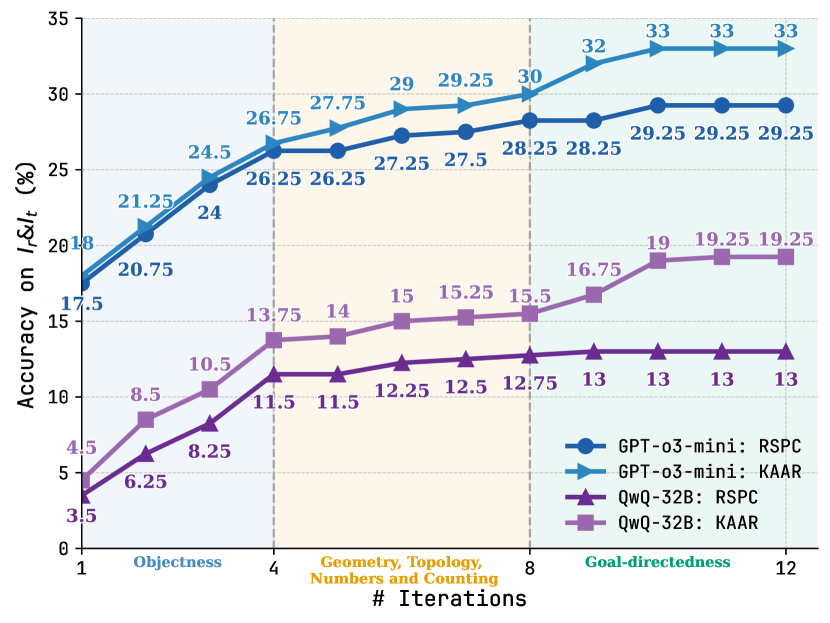
The image is a **line chart** visualizing the relationship between **iterations** and **accuracy** for four distinct model-task combinations. The chart is divided into three horizontal sections (color-coded) representing different task categories.
---
### **Axis Labels and Markers**
- **X-axis**:
- Title: `# Iterations`
- Subsections (color-coded):
1. **Objectness** (light blue)
2. **Geometry, Topology, Numbers and Counting** (beige)
3. **Goal-directedness** (light blue)
- Axis range: 1 to 12 iterations
- **Y-axis**:
- Title: `Accuracy on I_r&I_t (%)`
- Range: 0% to 35%
---
### **Legend**
- Located on the **right side** of the chart.
- **Color-coded entries**:
1. **Blue circles**: `GPT-o3-mini: RSPC`
2. **Blue triangles**: `GPT-o3-mini: KAAR`
3. **Purple squares**: `QwQ-32B: RSPC`
4. **Purple triangles**: `QwQ-32B: KAAR`
---
### **Data Series and Trends**
#### 1. **GPT-o3-mini: RSPC** (Blue circles)
- **Trend**: Steady upward slope.
- **Key data points**:
- Iteration 1: 18%
- Iteration 4: 26.75%
- Iteration 8: 30%
- Iteration 12: 33%
#### 2. **GPT-o3-mini: KAAR** (Blue triangles)
- **Trend**: Gradual upward slope with plateau.
- **Key data points**:
- Iteration 1: 6.25%
- Iteration 4: 26.25%
- Iteration 8: 28.25%
- Iteration 12: 29.25%
#### 3. **QwQ-32B: RSPC** (Purple squares)
- **Trend**: Sharp initial rise, then slower growth.
- **Key data points**:
- Iteration 1: 4.5%
- Iteration 4: 13.75%
- Iteration 8: 15.5%
- Iteration 12: 19.25%
#### 4. **QwQ-32B: KAAR** (Purple triangles)
- **Trend**: Consistent upward slope.
- **Key data points**:
- Iteration 1: 3.5%
- Iteration 4: 11.5%
- Iteration 8: 12.75%
- Iteration 12: 13%
---
### **Key Observations**
1. **Model Performance**:
- `GPT-o3-mini` outperforms `QwQ-32B` across all tasks, especially in **Goal-directedness** (33% vs. 19.25%).
- `RSPC` tasks consistently achieve higher accuracy than `KAAR` tasks for both models.
2. **Task Difficulty**:
- **Goal-directedness** (light blue section) shows the highest accuracy for all models.
- **Objectness** (light blue section) has the lowest starting accuracy (3.5–18%).
3. **Iteration Impact**:
- All models improve accuracy with more iterations, but `GPT-o3-mini` demonstrates faster convergence.
---
### **Spatial Grounding**
- **Legend position**: Right side of the chart.
- **Color consistency**:
- Blue markers (`GPT-o3-mini`) match blue lines.
- Purple markers (`QwQ-32B`) match purple lines.
---
### **Conclusion**
The chart demonstrates that `GPT-o3-mini` achieves higher accuracy than `QwQ-32B` across all tasks, with `RSPC` tasks outperforming `KAAR` tasks. Accuracy improves monotonically with iterations, though the rate of improvement varies by model and task.