## Bar Chart: Factual Associations, Associated Hallucinations, and Unassociated Hallucinations
### Overview
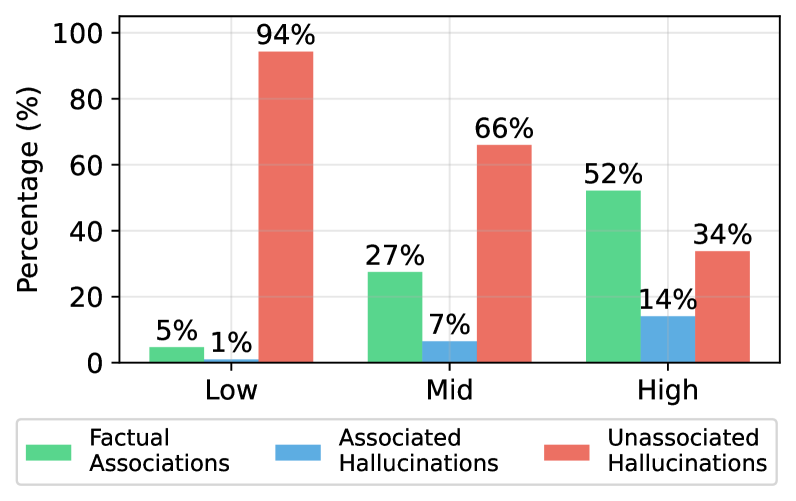
The image is a bar chart comparing the percentages of "Factual Associations", "Associated Hallucinations", and "Unassociated Hallucinations" across three categories: "Low", "Mid", and "High". The y-axis represents the percentage, ranging from 0% to 100%. The x-axis represents the three categories.
### Components/Axes
* **Y-axis:** "Percentage (%)", ranging from 0 to 100. Gridlines are present at intervals of 20.
* **X-axis:** Categorical axis with three categories: "Low", "Mid", and "High".
* **Legend:** Located at the bottom of the chart.
* Green: "Factual Associations"
* Blue: "Associated Hallucinations"
* Red: "Unassociated Hallucinations"
### Detailed Analysis
Here's a breakdown of the data for each category:
* **Low:**
* Factual Associations (Green): 5%
* Associated Hallucinations (Blue): 1%
* Unassociated Hallucinations (Red): 94%
* **Mid:**
* Factual Associations (Green): 27%
* Associated Hallucinations (Blue): 7%
* Unassociated Hallucinations (Red): 66%
* **High:**
* Factual Associations (Green): 52%
* Associated Hallucinations (Blue): 14%
* Unassociated Hallucinations (Red): 34%
**Trend Verification:**
* **Factual Associations (Green):** The percentage increases from "Low" to "High" (5% -> 27% -> 52%).
* **Associated Hallucinations (Blue):** The percentage increases from "Low" to "High" (1% -> 7% -> 14%).
* **Unassociated Hallucinations (Red):** The percentage decreases from "Low" to "High" (94% -> 66% -> 34%).
### Key Observations
* In the "Low" category, "Unassociated Hallucinations" dominate with 94%.
* "Factual Associations" show a significant increase from "Low" to "High", starting at 5% and reaching 52%.
* "Associated Hallucinations" are consistently the lowest percentage across all categories.
### Interpretation
The data suggests an inverse relationship between "Factual Associations" and "Unassociated Hallucinations" as the category moves from "Low" to "High". As the level increases, the percentage of "Factual Associations" increases, while the percentage of "Unassociated Hallucinations" decreases. "Associated Hallucinations" remain relatively low across all categories, suggesting they are not as prevalent as the other two types. The "Low" category is heavily dominated by "Unassociated Hallucinations", indicating a potential area of concern or focus for improvement.