## Line Graph: LM Loss vs. PFlOP/s-days Projections
### Overview
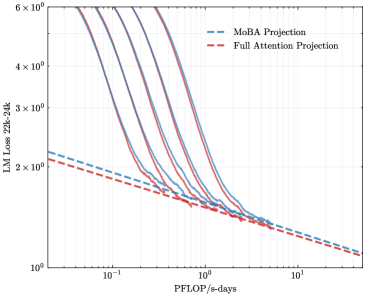
The image is a logarithmic line graph comparing two computational efficiency projections: "MoBA Projection" (blue dashed line) and "Full Attention Projection" (red dashed line). Both axes use logarithmic scales, with the x-axis representing computational resources (PFlOP/s-days) and the y-axis representing language model loss (LM Loss 22k-24k). The graph illustrates how loss decreases as computational resources increase, with both projections converging at higher resource levels.
### Components/Axes
- **X-axis (PFlOP/s-days)**: Logarithmic scale from 10⁻¹ to 10¹, labeled "PFlOP/s-days".
- **Y-axis (LM Loss 22k-24k)**: Logarithmic scale from 10⁰ to 6×10⁰, labeled "LM Loss 22k-24k".
- **Legend**:
- Blue dashed line: "MoBA Projection"
- Red dashed line: "Full Attention Projection"
- **Gridlines**: Faint gridlines for reference, aligned with logarithmic ticks.
### Detailed Analysis
1. **MoBA Projection (Blue Dashed Line)**:
- Starts at ~5×10⁰ LM Loss when PFlOP/s-days = 10⁻¹.
- Declines sharply, crossing the Full Attention Projection near PFlOP/s-days = 10⁰ (LM Loss ~2×10⁰).
- Continues to decrease, reaching ~1×10⁰ at PFlOP/s-days = 10¹.
2. **Full Attention Projection (Red Dashed Line)**:
- Begins slightly lower than MoBA at ~4.5×10⁰ LM Loss for PFlOP/s-days = 10⁻¹.
- Declines more gradually, intersecting MoBA near PFlOP/s-days = 10⁰.
- Converges with MoBA at ~1×10⁰ LM Loss by PFlOP/s-days = 10¹.
3. **Trends**:
- Both lines exhibit exponential decay on the logarithmic scale.
- MoBA Projection outperforms Full Attention at lower resource levels (PFlOP/s-days < 10⁰).
- Full Attention Projection becomes more efficient than MoBA at higher resource levels (PFlOP/s-days > 10⁰).
### Key Observations
- **Convergence Point**: The two projections intersect near PFlOP/s-days = 10⁰, where LM Loss ≈ 2×10⁰.
- **Efficiency Tradeoff**: MoBA is more efficient for low-resource scenarios, while Full Attention scales better for high-resource deployments.
- **Logarithmic Scale Impact**: The steep initial decline of both lines suggests diminishing returns at higher computational scales.
### Interpretation
The graph demonstrates a tradeoff between computational efficiency and resource allocation. MoBA Projection is preferable for systems with limited PFlOP/s-days (e.g., edge devices), as it achieves lower loss with fewer resources. However, Full Attention Projection becomes more advantageous as computational power increases, likely due to its ability to leverage parallelism or architectural optimizations at scale. The convergence at PFlOP/s-days = 10¹ implies that beyond this threshold, the choice between methods may depend on other factors (e.g., latency, energy consumption). This analysis is critical for optimizing resource allocation in large-scale language model deployments.