# Technical Data Extraction: Control Effect Analysis (Layer 28)
This document provides a comprehensive extraction of data from a technical visualization consisting of eight line charts and one heatmap. The data explores the "Control effect (d)" across different "Target axes" and "Affected axes" within a neural network (specifically layer 28), measured against the number of training examples.
---
## 1. Component Isolation
The image is divided into two primary sections:
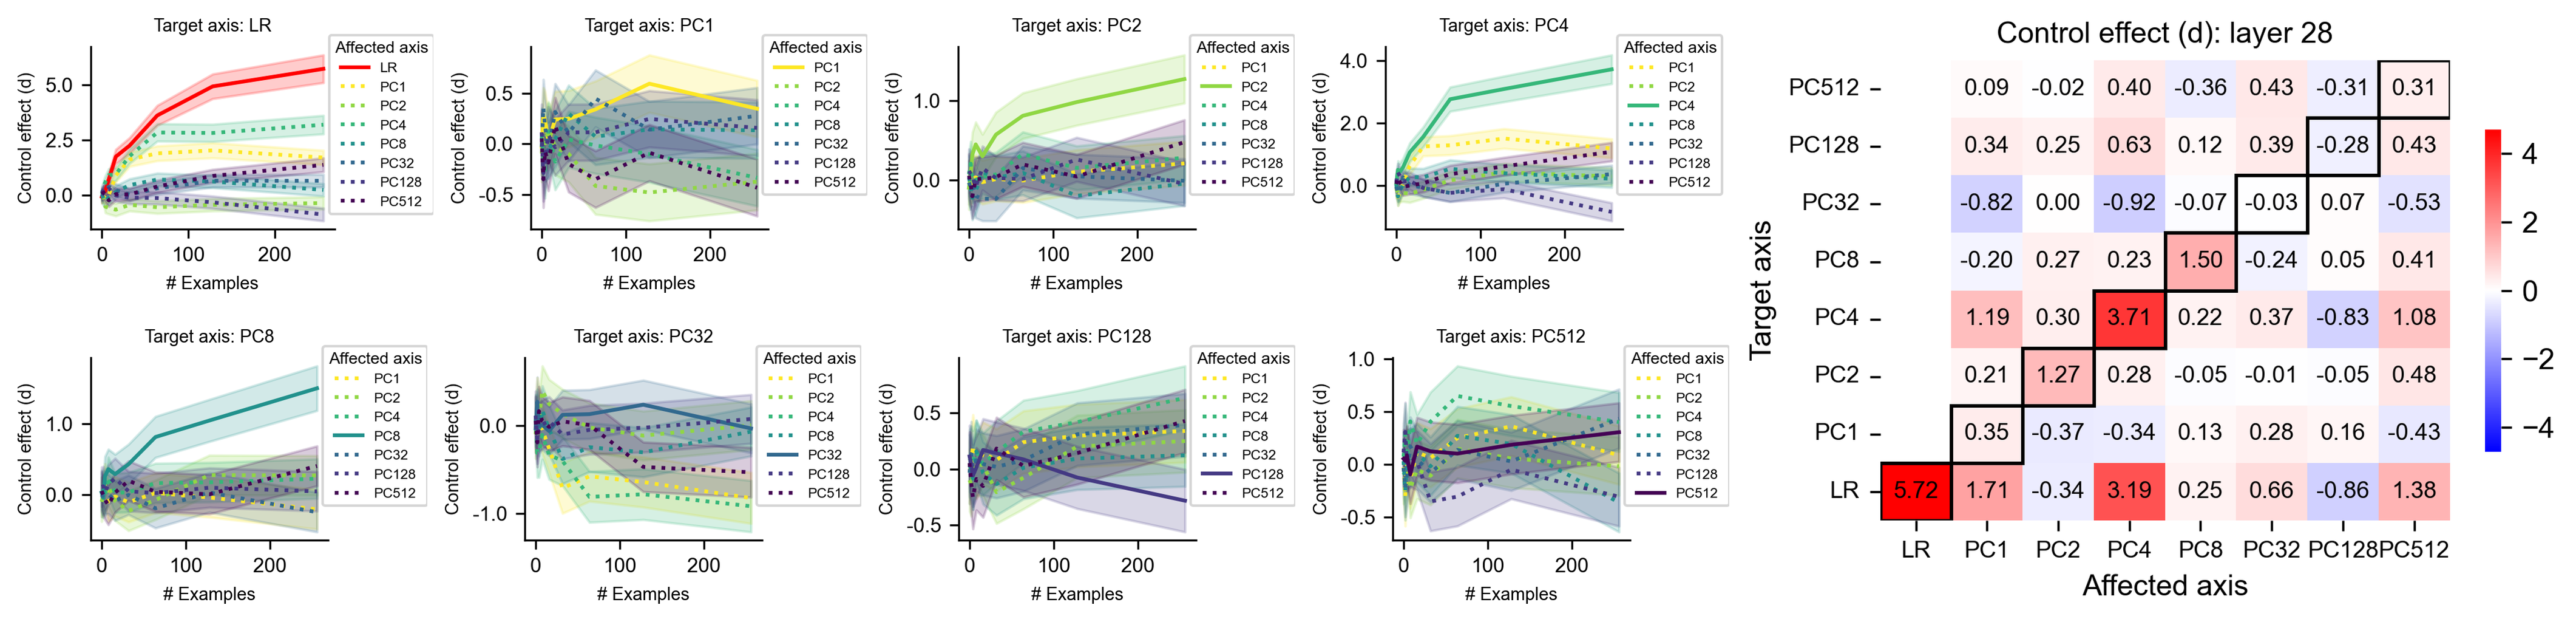
1. **Left/Center (Line Charts):** Eight individual plots showing the progression of control effects as the number of examples increases (0 to 250).
2. **Right (Heatmap):** A summary matrix showing the control effect at a specific snapshot (likely the final state of the training examples).
---
## 2. Heatmap Data Extraction
**Title:** Control effect (d): layer 28
**Y-Axis (Target axis):** PC512, PC128, PC32, PC8, PC4, PC2, PC1, LR
**X-Axis (Affected axis):** LR, PC1, PC2, PC4, PC8, PC32, PC128, PC512
**Legend (Color Bar):** Ranges from -4 (Blue) to 0 (White) to +4 (Red).
### Data Table (Reconstructed)
The diagonal (where Target axis = Affected axis) is highlighted with a bold black border in the source.
| Target \ Affected | LR | PC1 | PC2 | PC4 | PC8 | PC32 | PC128 | PC512 |
| :--- | :---: | :---: | :---: | :---: | :---: | :---: | :---: | :---: |
| **PC512** | 0.09 | -0.02 | 0.40 | -0.36 | 0.43 | -0.31 | 0.31 | |
| **PC128** | 0.34 | 0.25 | 0.63 | 0.12 | 0.39 | -0.28 | 0.43 | |
| **PC32** | -0.82 | 0.00 | -0.92 | -0.07 | -0.03 | 0.07 | -0.53 | |
| **PC8** | -0.20 | 0.27 | 0.23 | 1.50 | -0.24 | 0.05 | 0.41 | |
| **PC4** | 1.19 | 0.30 | 3.71 | 0.22 | 0.37 | -0.83 | 1.08 | |
| **PC2** | 0.21 | 1.27 | 0.28 | -0.05 | -0.01 | -0.05 | 0.48 | |
| **PC1** | 0.35 | -0.37 | -0.34 | 0.13 | 0.28 | 0.16 | -0.43 | |
| **LR** | 5.72 | 1.71 | -0.34 | 3.19 | 0.25 | 0.66 | -0.86 | 1.38 |
*Note: The heatmap contains a slight visual misalignment in the top right corner labels; the table above reflects the numerical values provided in the cells.*
---
## 3. Line Chart Analysis (Target Axis Series)
Each chart plots **Control effect (d)** (y-axis) vs **# Examples** (x-axis, 0-250). Shaded areas represent confidence intervals.
### Common Legend (Affected axis)
* **LR:** Solid Red line
* **PC1:** Dotted Yellow line
* **PC2:** Dotted Light Green line
* **PC4:** Dotted Medium Green line
* **PC8:** Dotted Teal line
* **PC32:** Dotted Blue line
* **PC128:** Dotted Purple line
* **PC512:** Dotted Dark Purple line
* *Note: In each specific "Target axis" plot, the line corresponding to that axis becomes a **solid, thick line**.*
### Individual Plot Trends
1. **Target axis: LR**
* **Trend:** The LR (Solid Red) line shows a sharp, logarithmic-style increase, plateauing near a value of 5.7.
* **Secondary Effects:** PC4 (Dotted Green) also shows a significant upward trend, reaching ~3.0.
2. **Target axis: PC1**
* **Trend:** PC1 (Solid Yellow) is highly volatile initially, stabilizing around 0.3-0.4.
* **Secondary Effects:** Most other axes cluster around 0.0, with PC2 showing a slight downward trend to -0.4.
3. **Target axis: PC2**
* **Trend:** PC2 (Solid Light Green) shows a steady upward slope, reaching ~1.3.
* **Secondary Effects:** Most other axes remain flat near 0.0.
4. **Target axis: PC4**
* **Trend:** PC4 (Solid Medium Green) shows a strong upward trend, reaching ~3.7.
* **Secondary Effects:** PC1 (Yellow) shows a moderate increase to ~1.5.
5. **Target axis: PC8**
* **Trend:** PC8 (Solid Teal) increases steadily to ~1.5.
* **Secondary Effects:** Other axes remain largely grouped between -0.5 and 0.5.
6. **Target axis: PC32**
* **Trend:** PC32 (Solid Blue) remains very close to 0.0 throughout the duration.
* **Secondary Effects:** PC2 (Green) and PC128 (Purple) show slight negative trends toward -0.5.
7. **Target axis: PC128**
* **Trend:** PC128 (Solid Purple) shows a slight upward trend, ending near 0.4.
* **Secondary Effects:** PC2 (Green) shows a similar upward trend, ending slightly higher than the target axis.
8. **Target axis: PC512**
* **Trend:** PC512 (Solid Dark Purple) shows a gradual increase, ending near 0.3.
* **Secondary Effects:** PC2 (Green) shows a more pronounced upward trend in this plot, reaching ~0.6.
---
## 4. Summary of Findings
* **Strongest Control:** The "LR" target axis exhibits the strongest control effect (~5.7), followed by "PC4" (~3.7).
* **Cross-Talk:** There is significant cross-talk between LR and PC4, and between PC4 and PC2, as evidenced by the high values in the heatmap and the rising dotted lines in the respective line charts.
* **Stability:** PC32 appears to be the most "stable" or least affected target axis, with values remaining near zero regardless of the number of examples.