## Horizontal Bar Chart: LLM Comparison
### Overview
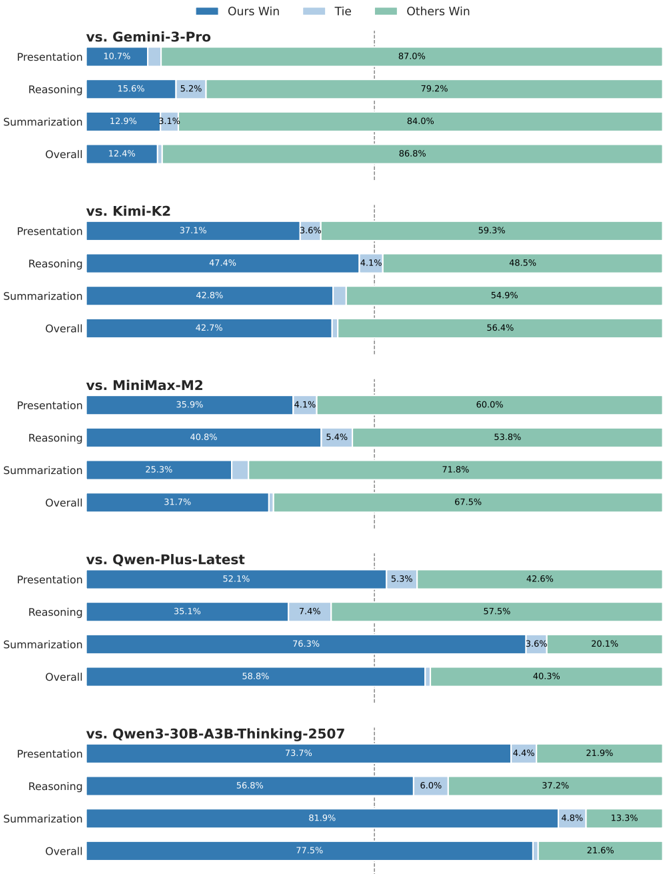
The image is a horizontal bar chart comparing the performance of an unspecified model ("Ours") against several other Large Language Models (LLMs) across different tasks: Presentation, Reasoning, Summarization, and Overall. The chart displays the percentage of wins for "Ours," ties, and wins for "Others" in each category. The comparisons are made against Gemini-3-Pro, Kimi-K2, MiniMax-M2, Qwen-Plus-Latest, and Qwen3-30B-A3B-Thinking-2507.
### Components/Axes
* **Title:** Comparison of LLM Performance
* **Y-Axis (Categories):**
* vs. Gemini-3-Pro: Presentation, Reasoning, Summarization, Overall
* vs. Kimi-K2: Presentation, Reasoning, Summarization, Overall
* vs. MiniMax-M2: Presentation, Reasoning, Summarization, Overall
* vs. Qwen-Plus-Latest: Presentation, Reasoning, Summarization, Overall
* vs. Qwen3-30B-A3B-Thinking-2507: Presentation, Reasoning, Summarization, Overall
* **X-Axis (Percentage):** Represented by the length of the bars. Values are explicitly labeled on each bar segment.
* **Legend (Top-Right):**
* Blue: Ours Win
* Light Blue: Tie
* Green: Others Win
### Detailed Analysis or Content Details
**1. vs. Gemini-3-Pro**
* Presentation: Ours Win - 10.7%, Tie - 0%, Others Win - 87.0%
* Reasoning: Ours Win - 15.6%, Tie - 5.2%, Others Win - 79.2%
* Summarization: Ours Win - 12.9%, Tie - 3.1%, Others Win - 84.0%
* Overall: Ours Win - 12.4%, Tie - 0%, Others Win - 86.8%
**2. vs. Kimi-K2**
* Presentation: Ours Win - 37.1%, Tie - 3.6%, Others Win - 59.3%
* Reasoning: Ours Win - 47.4%, Tie - 4.1%, Others Win - 48.5%
* Summarization: Ours Win - 42.8%, Tie - 0%, Others Win - 54.9%
* Overall: Ours Win - 42.7%, Tie - 0%, Others Win - 56.4%
**3. vs. MiniMax-M2**
* Presentation: Ours Win - 35.9%, Tie - 4.1%, Others Win - 60.0%
* Reasoning: Ours Win - 40.8%, Tie - 5.4%, Others Win - 53.8%
* Summarization: Ours Win - 25.3%, Tie - 0%, Others Win - 71.8%
* Overall: Ours Win - 31.7%, Tie - 0%, Others Win - 67.5%
**4. vs. Qwen-Plus-Latest**
* Presentation: Ours Win - 52.1%, Tie - 5.3%, Others Win - 42.6%
* Reasoning: Ours Win - 35.1%, Tie - 7.4%, Others Win - 57.5%
* Summarization: Ours Win - 76.3%, Tie - 3.6%, Others Win - 20.1%
* Overall: Ours Win - 58.8%, Tie - 0%, Others Win - 40.3%
**5. vs. Qwen3-30B-A3B-Thinking-2507**
* Presentation: Ours Win - 73.7%, Tie - 4.4%, Others Win - 21.9%
* Reasoning: Ours Win - 56.8%, Tie - 6.0%, Others Win - 37.2%
* Summarization: Ours Win - 81.9%, Tie - 4.8%, Others Win - 13.3%
* Overall: Ours Win - 77.5%, Tie - 0%, Others Win - 21.6%
### Key Observations
* **Gemini-3-Pro:** "Ours" performs poorly against Gemini-3-Pro across all categories.
* **Kimi-K2:** "Ours" shows a more competitive performance, with wins approaching 50% in Reasoning.
* **MiniMax-M2:** Performance is similar to Kimi-K2, but slightly lower in Summarization.
* **Qwen-Plus-Latest:** "Ours" performs strongly in Summarization, but weaker in Reasoning.
* **Qwen3-30B-A3B-Thinking-2507:** "Ours" demonstrates the best performance, particularly in Summarization and Overall.
* **Ties:** Ties are generally a small percentage, often 5% or less, except for Reasoning against Qwen-Plus-Latest (7.4%).
* **Summarization:** The performance of "Ours" varies significantly in summarization, ranging from 12.9% against Gemini-3-Pro to 81.9% against Qwen3-30B-A3B-Thinking-2507.
### Interpretation
The chart indicates that the performance of "Ours" is highly dependent on the specific LLM it is compared against. It struggles against Gemini-3-Pro but performs exceptionally well against Qwen3-30B-A3B-Thinking-2507. The "Ours" model shows particular strength in summarization when compared to Qwen-Plus-Latest and Qwen3-30B-A3B-Thinking-2507. The data suggests that "Ours" may have specific architectural or training advantages for certain tasks or against certain model architectures. The consistent underperformance against Gemini-3-Pro warrants further investigation to understand the underlying reasons.