## Bar Chart: CoC (LM)
### Overview
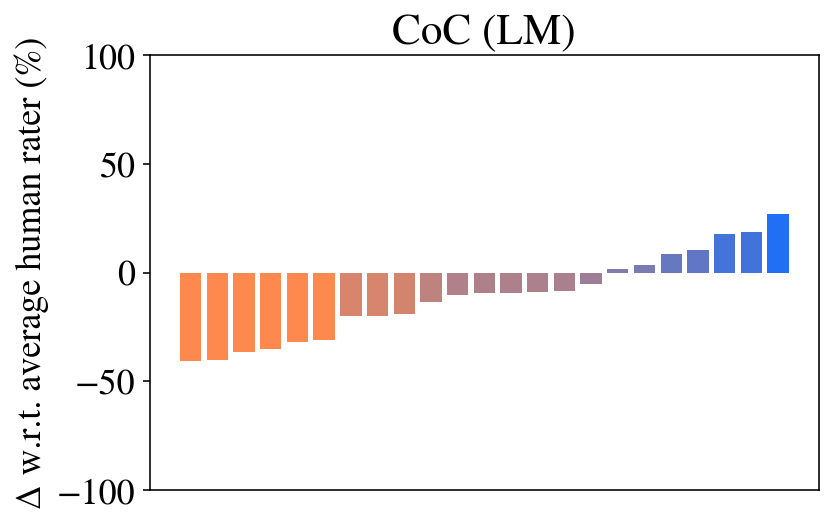
The image is a bar chart titled "CoC (LM)". It displays the difference in performance between a system and average human raters, expressed as a percentage. The bars are arranged along the x-axis, with the y-axis representing the percentage difference. The bars are colored in a gradient, transitioning from orange on the left to blue on the right.
### Components/Axes
* **Title:** CoC (LM)
* **Y-axis Label:** Δ w.r.t. average human rater (%)
* **Y-axis Scale:** -100, -50, 0, 50, 100
* **X-axis:** Implicit categorical axis represented by the sequence of bars.
### Detailed Analysis
The chart consists of a series of vertical bars. The height of each bar represents the percentage difference relative to the average human rater.
* **Left Side (Orange Bars):** The bars on the left side of the chart are orange and extend downwards, indicating that the system performed worse than the average human rater for these categories. The values range from approximately -20% to -40%.
* **Middle (Gradient Bars):** The bars in the middle transition from orange to purple, indicating a gradual improvement in performance. The values range from approximately -20% to 0%.
* **Right Side (Blue Bars):** The bars on the right side of the chart are blue and extend upwards, indicating that the system performed better than the average human rater for these categories. The values range from approximately 0% to 25%.
Specific bar heights (approximate):
* Leftmost orange bar: -40%
* First purple bar: -20%
* First blue bar: 2%
* Rightmost blue bar: 25%
### Key Observations
* The system's performance varies significantly across different categories.
* The system performs worse than average human raters for the categories represented by the orange bars.
* The system performs better than average human raters for the categories represented by the blue bars.
* There is a gradual transition in performance from worse than average to better than average.
### Interpretation
The bar chart compares the performance of a system (likely a language model, given the "LM" in the title) against average human raters across a set of categories. The negative values on the left side indicate areas where the system underperforms compared to humans, while the positive values on the right side indicate areas where the system outperforms humans. The gradient in the middle suggests a spectrum of performance, with some categories showing near-parity between the system and human raters. The chart highlights the strengths and weaknesses of the system relative to human judgment.