## Grouped Bar Chart: PRM Performance Comparison (Best-of-8 vs. ProcessBench)
### Overview
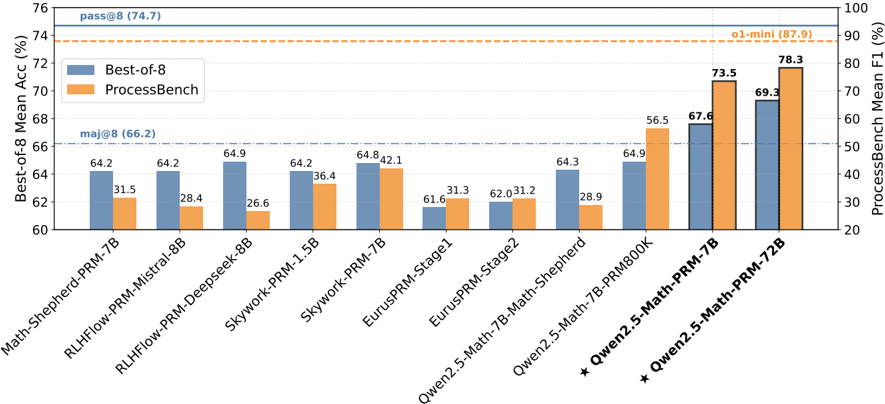
This image is a dual-axis grouped bar chart comparing the performance of ten different Process Reward Models (PRMs) across two distinct evaluation metrics: "Best-of-8" (Mean Accuracy %) and "ProcessBench" (Mean F1 %). The chart illustrates how various models, ranging from smaller 1.5B parameter models to the larger 72B parameter models, perform on these benchmarks.
### Components/Axes
* **X-Axis (Categorical):** Lists the ten models evaluated, from left to right:
1. Math-Shepherd-PRM-7B
2. RLHFlow-PRM-Mistral-8B
3. RLHFlow-PRM-Deepseek-8B
4. Skywork-PRM-1.5B
5. Skywork-PRM-7B
6. EurusPRM-Stage1
7. EurusPRM-Stage2
8. Qwen2.5-Math-7B-PRM800K
9. Qwen2.5-Math-PRM-7B (marked with a star)
10. Qwen2.5-Math-PRM-72B (marked with a star)
* **Left Y-Axis:** "Best-of-8 Mean Acc (%)". Scale ranges from 60 to 76.
* **Right Y-Axis:** "ProcessBench Mean F1 (%)". Scale ranges from 20 to 100.
* **Legend (Top-Left):**
* **Blue Bar:** Best-of-8
* **Orange Bar:** ProcessBench
* **Reference Lines:**
* **Solid Blue Line:** "pass@8 (74.7)" (Horizontal line across the top).
* **Dashed Orange Line:** "o1-mini (87.9)" (Horizontal line near the top).
* **Dash-Dot Blue Line:** "maj@8 (66.2)" (Horizontal line across the middle).
### Detailed Analysis
The chart uses a dual-axis system. Blue bars correspond to the left axis (Best-of-8), and orange bars correspond to the right axis (ProcessBench).
| Model | Best-of-8 (Blue) | ProcessBench (Orange) |
| :--- | :--- | :--- |
| Math-Shepherd-PRM-7B | 64.2 | 31.5 |
| RLHFlow-PRM-Mistral-8B | 64.2 | 28.4 |
| RLHFlow-PRM-Deepseek-8B | 64.9 | 26.6 |
| Skywork-PRM-1.5B | 64.2 | 36.4 |
| Skywork-PRM-7B | 64.8 | 42.1 |
| EurusPRM-Stage1 | 61.6 | 31.3 |
| EurusPRM-Stage2 | 62.0 | 31.2 |
| Qwen2.5-Math-7B-PRM800K | 64.9 | 56.5 |
| Qwen2.5-Math-PRM-7B | 67.6 | 73.5 |
| Qwen2.5-Math-PRM-72B | 69.3 | 78.3 |
**Visual Trends:**
* **Best-of-8 (Blue Bars):** Most models hover in the 64-65% range. There is a noticeable dip with the EurusPRM models (61.6-62.0%) and a significant upward trend starting with the Qwen2.5 series, peaking at 69.3%.
* **ProcessBench (Orange Bars):** This metric shows much higher variance. The performance starts low (26-36% range for the first seven models) and increases dramatically with the Qwen2.5 models, culminating in the highest value of 78.3%.
### Key Observations
* **Dominance of Qwen2.5:** The Qwen2.5-Math-PRM-72B model is the clear top performer on both metrics, significantly outperforming all other models listed.
* **Metric Sensitivity:** The ProcessBench metric appears to be more sensitive to model improvements than the Best-of-8 metric. While Best-of-8 scores improved by roughly 5-7 percentage points from the baseline models to the top model, ProcessBench scores improved by over 50 percentage points (from ~26% to 78.3%).
* **Baseline Gaps:** Despite the strong performance of the Qwen2.5-Math-PRM-72B, it still falls short of the "pass@8 (74.7)" and "o1-mini (87.9)" reference lines, indicating that even the best-performing PRM in this set has room for improvement to reach these benchmarks.
### Interpretation
This data demonstrates a clear correlation between model scale/architecture and performance on process-based reasoning tasks. The Qwen2.5 series, particularly the 72B variant, represents a significant leap in capability compared to the earlier models (like Math-Shepherd or RLHFlow).
The use of two different metrics suggests that "Best-of-8" might be a saturated metric where models are clustered closely together, making it harder to distinguish performance differences. In contrast, "ProcessBench" provides a much wider dynamic range, effectively highlighting the superior reasoning capabilities of the newer Qwen models. The reference lines (pass@8 and o1-mini) serve as "north stars," showing that while the field is advancing rapidly, the current state-of-the-art PRMs are still trailing behind the performance levels of the o1-mini model on the ProcessBench metric.