## Line Chart: HellaSwag Performance vs. Training Tokens
### Overview
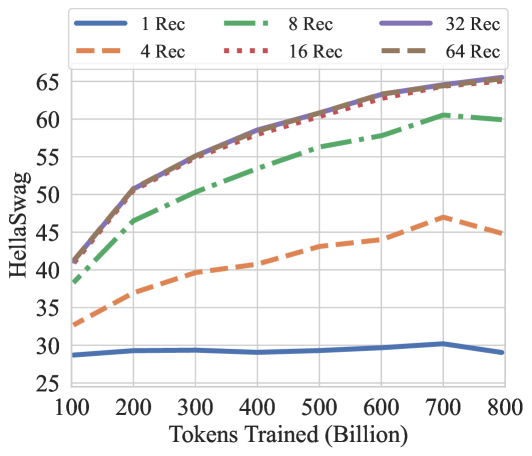
This image is a line chart plotting the performance of a model on the HellaSwag benchmark against the number of tokens it was trained on. The chart compares six different model configurations, differentiated by the number of "Rec" (likely recommendations or a similar parameter). The overall trend shows that performance improves with more training tokens and with a higher number of "Rec," though with diminishing returns.
### Components/Axes
* **Chart Type:** Multi-line chart.
* **X-Axis:** Labeled **"Tokens Trained (Billion)"**. The scale runs from 100 to 800 billion, with major tick marks every 100 billion.
* **Y-Axis:** Labeled **"HellaSwag"**. The scale runs from 25 to 65, with major tick marks every 5 units.
* **Legend:** Positioned at the **top center** of the chart. It contains six entries, each with a distinct color and line style:
* **1 Rec:** Solid blue line.
* **4 Rec:** Dashed orange line.
* **8 Rec:** Dash-dot green line.
* **16 Rec:** Dotted red line.
* **32 Rec:** Solid purple line.
* **64 Rec:** Dashed brown line.
* **Grid:** A light gray grid is present in the background.
### Detailed Analysis
The chart displays six data series. Below is an analysis of each, including approximate data points extracted from the visual plot.
**1. 1 Rec (Solid Blue Line)**
* **Trend:** Nearly flat, showing minimal improvement with increased training.
* **Data Points (Approximate):**
* 100B tokens: ~29
* 200B tokens: ~29.5
* 400B tokens: ~29
* 600B tokens: ~29.5
* 700B tokens: ~30
* 800B tokens: ~29
**2. 4 Rec (Dashed Orange Line)**
* **Trend:** Steady, moderate upward slope.
* **Data Points (Approximate):**
* 100B tokens: ~33
* 200B tokens: ~37
* 400B tokens: ~41
* 600B tokens: ~44
* 700B tokens: ~47
* 800B tokens: ~45
**3. 8 Rec (Dash-Dot Green Line)**
* **Trend:** Strong upward slope, with a slight dip at the final data point.
* **Data Points (Approximate):**
* 100B tokens: ~38
* 200B tokens: ~46
* 400B tokens: ~53
* 600B tokens: ~58
* 700B tokens: ~60
* 800B tokens: ~59
**4. 16 Rec (Dotted Red Line)**
* **Trend:** Very strong upward slope, closely following the 32 Rec and 64 Rec lines.
* **Data Points (Approximate):**
* 100B tokens: ~41
* 200B tokens: ~51
* 400B tokens: ~58
* 600B tokens: ~62
* 700B tokens: ~64
* 800B tokens: ~65
**5. 32 Rec (Solid Purple Line)**
* **Trend:** Very strong upward slope, nearly identical to the 16 Rec and 64 Rec lines, often appearing as the topmost line.
* **Data Points (Approximate):**
* 100B tokens: ~41
* 200B tokens: ~51
* 400B tokens: ~59
* 600B tokens: ~63
* 700B tokens: ~65
* 800B tokens: ~65.5
**6. 64 Rec (Dashed Brown Line)**
* **Trend:** Very strong upward slope, nearly identical to the 16 Rec and 32 Rec lines.
* **Data Points (Approximate):**
* 100B tokens: ~41
* 200B tokens: ~51
* 400B tokens: ~58
* 600B tokens: ~62
* 700B tokens: ~64
* 800B tokens: ~65
### Key Observations
1. **Performance Hierarchy:** There is a clear and consistent performance hierarchy based on the "Rec" value: 1 Rec < 4 Rec < 8 Rec < {16 Rec, 32 Rec, 64 Rec}.
2. **Diminishing Returns:** The performance gap between consecutive "Rec" values narrows significantly at higher values. The lines for 16, 32, and 64 Rec are tightly clustered, indicating minimal additional benefit beyond 16 Rec for this metric and training range.
3. **Training Saturation:** The 1 Rec model shows almost no benefit from additional training beyond 100B tokens. The 4 Rec and 8 Rec models show continued improvement but at a slower rate at higher token counts. The top three models (16/32/64 Rec) show a consistent, though slightly decelerating, upward trend.
4. **Anomaly:** The 4 Rec and 8 Rec lines show a slight performance dip between 700B and 800B tokens, while the top models continue to rise.
### Interpretation
This chart demonstrates the scaling behavior of a model on the HellaSwag commonsense reasoning benchmark. The data suggests two primary levers for improving performance: **training data volume** (tokens) and a model parameter denoted as **"Rec"**.
* **"Rec" as a Critical Hyperparameter:** The "Rec" parameter is a dominant factor. A single Rec is insufficient for strong performance, but increasing it to 8 or 16 yields dramatic gains. The clustering of the 16, 32, and 64 Rec lines suggests a **performance ceiling** for this specific benchmark under these training conditions, where further increases in this parameter yield negligible returns.
* **Data Scaling is Necessary but Not Sufficient:** For low-"Rec" models (1 Rec), adding more training data provides almost no benefit, implying the model lacks the capacity to learn from it. For higher-"Rec" models, performance scales reliably with data, but the rate of improvement slows, indicating the model is approaching its capacity for this task.
* **Practical Implication:** The most cost-effective configuration appears to be around **16 Rec**, as it achieves nearly the same performance as 32 or 64 Rec. Training beyond 600-700 billion tokens provides smaller marginal gains for the top models. The chart provides a clear visual guide for balancing computational resources (training tokens) against model complexity ("Rec") to achieve a target performance level on HellaSwag.