\n
## Pie Chart: Q3 - Categorization of Prominent Patterns
### Overview
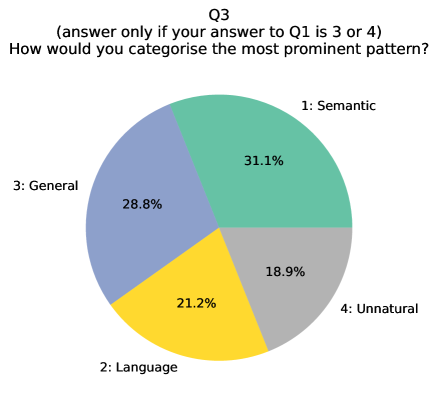
This image displays a pie chart from a survey or questionnaire, specifically labeled as question "Q3". The chart visualizes the distribution of responses to the question: "How would you categorise the most prominent pattern?" A conditional note indicates this question was only presented to respondents who answered "3 or 4" to a previous question, "Q1".
### Components/Axes
* **Chart Title:** "Q3"
* **Subtitle/Instruction:** "(answer only if your answer to Q1 is 3 or 4)"
* **Question Text:** "How would you categorise the most prominent pattern?"
* **Chart Type:** Pie chart with four segments.
* **Legend/Labels:** Labels are placed directly adjacent to their corresponding pie slices.
* **1: Semantic** (Teal/Green slice, top-right quadrant)
* **2: Language** (Yellow slice, bottom quadrant)
* **3: General** (Blue-gray slice, left quadrant)
* **4: Unnatural** (Gray slice, bottom-right quadrant)
### Detailed Analysis
The pie chart is divided into four categories with the following percentages and visual characteristics:
1. **Semantic (Category 1):**
* **Percentage:** 31.1%
* **Color:** Teal/Green
* **Position:** Occupies the largest segment, starting from the top (12 o'clock position) and extending clockwise to approximately the 4 o'clock position.
* **Trend/Size:** This is the largest segment, representing nearly one-third of the total.
2. **Language (Category 2):**
* **Percentage:** 21.2%
* **Color:** Yellow
* **Position:** Located at the bottom of the chart, between the "General" and "Unnatural" segments.
* **Trend/Size:** The third-largest segment.
3. **General (Category 3):**
* **Percentage:** 28.8%
* **Color:** Blue-gray
* **Position:** Occupies the left side of the chart, from approximately the 8 o'clock to the 12 o'clock position.
* **Trend/Size:** The second-largest segment, representing over a quarter of the total.
4. **Unnatural (Category 4):**
* **Percentage:** 18.9%
* **Color:** Gray
* **Position:** Located in the bottom-right quadrant, between the "Semantic" and "Language" segments.
* **Trend/Size:** The smallest segment.
**Data Verification:** The sum of the percentages (31.1% + 21.2% + 28.8% + 18.9%) equals 100.0%, confirming the data is complete for this respondent group.
### Key Observations
* **Dominant Category:** "Semantic" is the most frequently cited category for the most prominent pattern, chosen by 31.1% of the relevant respondents.
* **Secondary Category:** "General" is a close second at 28.8%, indicating a significant portion of respondents use a broad, non-specific categorization.
* **Combined Majority:** The "Semantic" and "General" categories together account for 59.9% of responses, suggesting that nearly six in ten respondents identify the prominent pattern as either meaning-based or broadly general.
* **Smallest Segment:** "Unnatural" is the least selected category at 18.9%, implying that patterns perceived as unnatural are less commonly identified as the *most* prominent by this group.
* **Balanced Distribution:** While there is a clear leader, no single category holds a majority (>50%). The distribution is relatively balanced across the four options, with the largest gap being 12.2 percentage points between the first and last categories.
### Interpretation
This chart provides insight into how a specific subset of survey respondents (those who gave a "3 or 4" answer to Q1) conceptualize the primary pattern they observed. The data suggests that for this group, **semantic or meaning-based patterns are the most salient**, followed closely by patterns described in general terms. The relatively lower selection of "Language" and "Unnatural" indicates that respondents are more likely to frame the prominent pattern in terms of its meaning or a general quality rather than attributing it specifically to linguistic structure or perceiving it as artificial/unnatural.
The conditional nature of the question ("answer only if...") is critical. It means these results are not representative of all survey participants, but only of a filtered subgroup. The findings are therefore specific to the characteristics of that subgroup, which answered "3 or 4" to Q1. Without knowing what Q1 asked, the exact context is limited, but the chart effectively communicates the internal distribution of pattern categorization within this defined cohort.