## Scatter Plot with Linear Trend Line: Model Size Scaling
### Overview
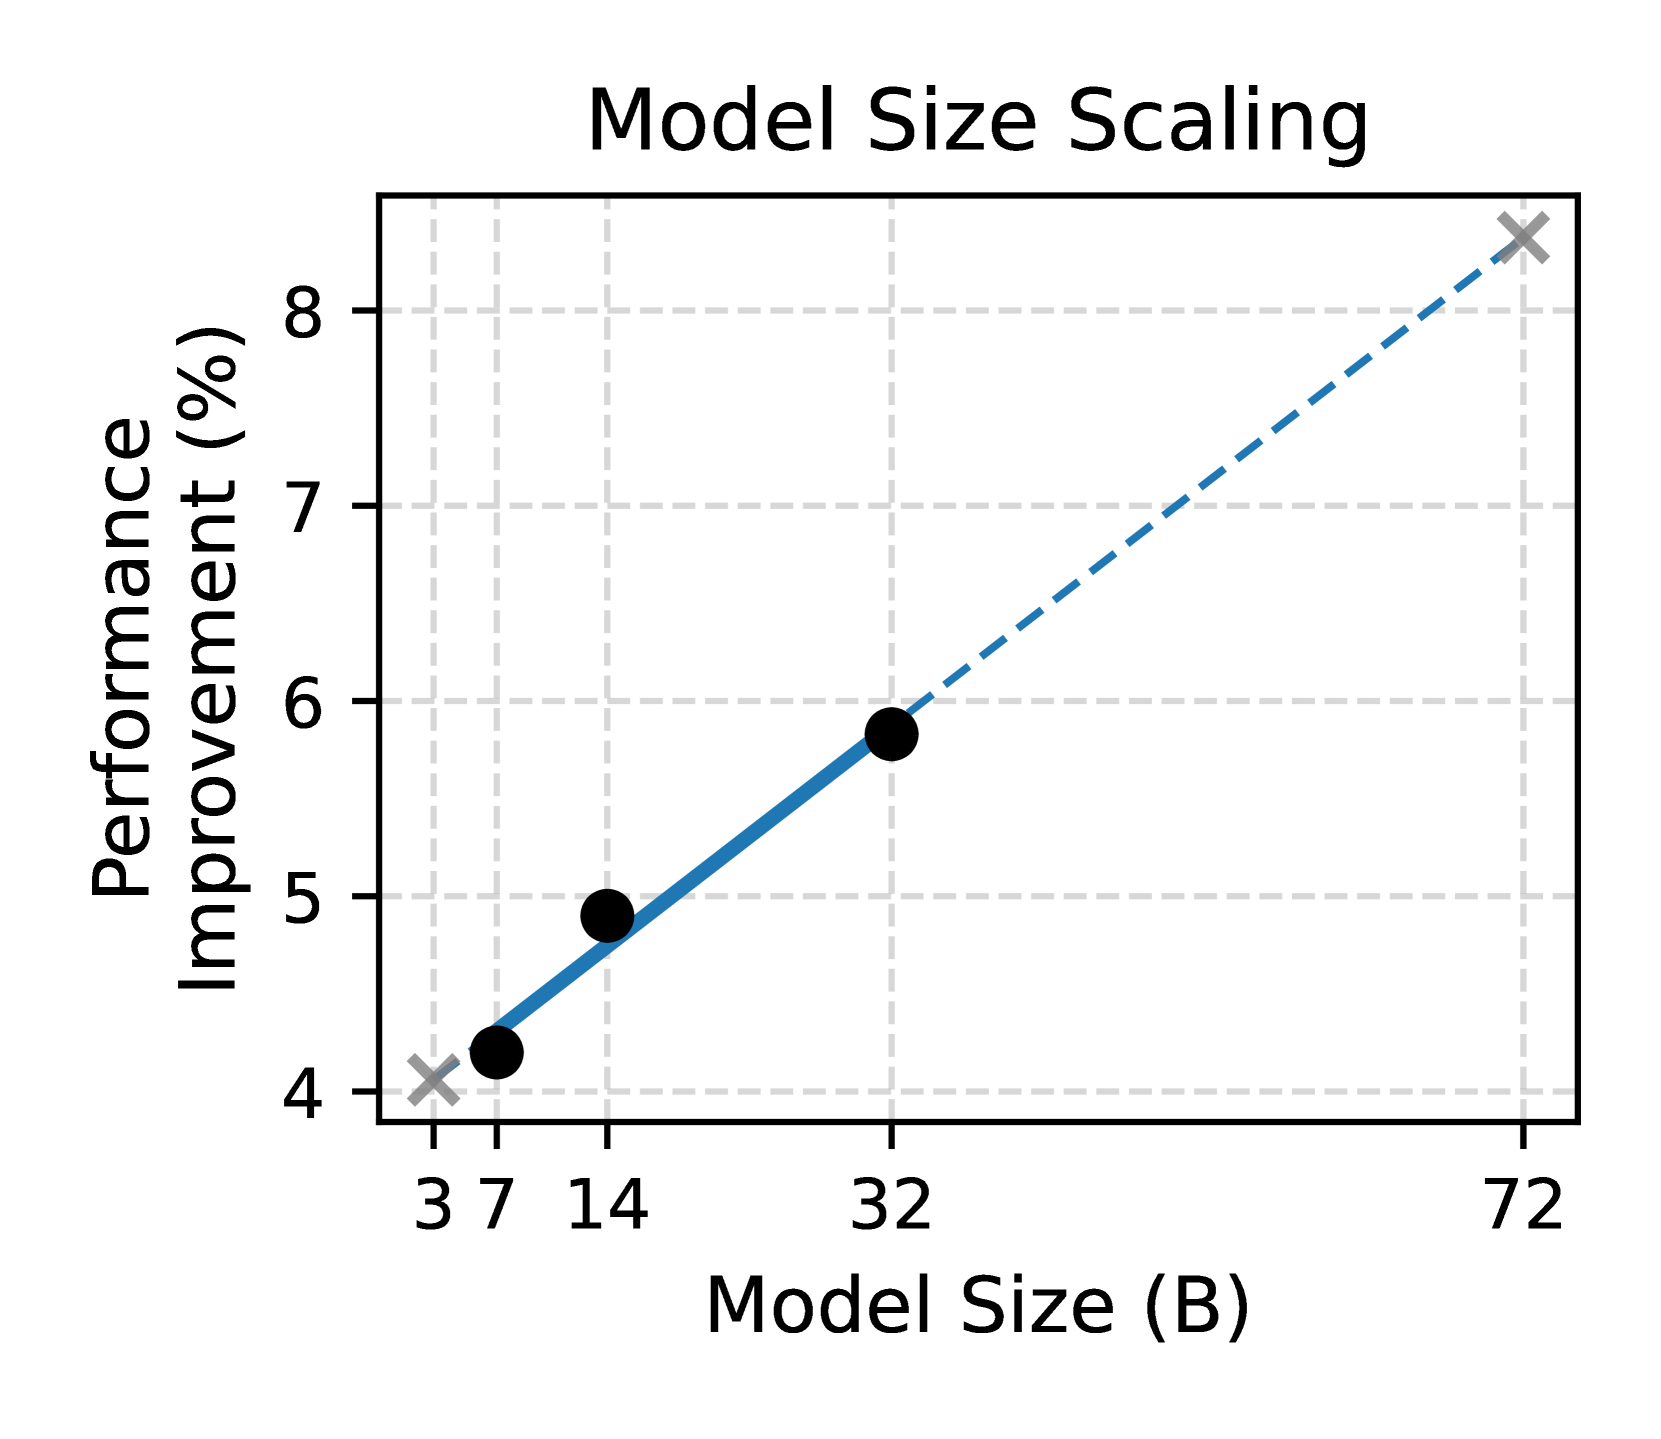
This image is a scatter plot chart titled "Model Size Scaling." It illustrates the relationship between the size of a model (measured in billions of parameters, "B") and the corresponding percentage improvement in performance. The chart includes observed data points and a fitted trend line that extends beyond the observed data range.
### Components/Axes
* **Title:** "Model Size Scaling" (centered at the top).
* **X-Axis:** Labeled "Model Size (B)". The axis has discrete, non-linearly spaced tick marks at the values: 3, 7, 14, 32, and 72.
* **Y-Axis:** Labeled "Performance Improvement (%)". The axis has linear tick marks at integer intervals from 4 to 8.
* **Legend:** Located in the top-left corner of the plot area. It contains two entries:
* A black circle symbol labeled "Observed Data".
* A blue dashed line symbol labeled "Trend Line".
* **Grid:** A light gray, dashed grid is present in the background.
### Detailed Analysis
**Data Series and Points:**
1. **Observed Data (Black Circles):**
* The first point is located at approximately **Model Size = 7 B**, **Performance Improvement = ~4.2%**.
* The second point is located at approximately **Model Size = 14 B**, **Performance Improvement = ~4.9%**.
* The third point is located at approximately **Model Size = 32 B**, **Performance Improvement = ~5.8%**.
* **Trend Verification:** The three black data points show a clear upward trend from left to right.
2. **Trend Line (Blue Dashed Line):**
* The line is a straight, upward-sloping dashed line.
* It originates from a gray 'X' marker at the coordinate **(3, 4)**.
* It passes through or very near the three observed data points.
* It terminates at another gray 'X' marker at the coordinate **(72, ~8.3)**.
* **Trend Verification:** The line has a consistent positive slope, indicating a direct, linear relationship between the logarithm of model size (given the x-axis spacing) and performance improvement.
### Key Observations
* **Positive Correlation:** There is a strong, positive correlation between model size and performance improvement. As model size increases, performance improvement increases.
* **Consistent Increase:** The observed data points (7B, 14B, 32B) show a steady, nearly linear increase in performance improvement on this scale.
* **Extrapolation:** The trend line is extrapolated beyond the observed data range, predicting a performance improvement of approximately **8.3%** for a **72B** parameter model.
* **Anchor Points:** The trend line is explicitly anchored at the points (3, 4) and (72, ~8.3), marked with gray 'X's, which may represent theoretical or projected bounds.
### Interpretation
The chart demonstrates a scaling law for the model in question: increasing the number of parameters leads to predictable gains in performance. The linear fit on this plot (where the x-axis is logarithmically spaced) suggests that performance improvement scales linearly with the *logarithm* of model size. This is a common finding in neural scaling laws.
The data suggests that investing in larger models yields measurable benefits, but the rate of improvement per additional parameter may diminish (as moving from 7B to 14B gains ~0.7%, while moving from 14B to 32B gains ~0.9%, but over a much larger parameter increase). The extrapolation to 72B provides a forecast for future model development, though predictions beyond the observed data (32B) carry inherent uncertainty. The chart effectively communicates that model size is a critical and predictable driver of performance for this specific task or metric.