## Diagram: Early-Stopping Drafting and Dynamic Verification
### Overview
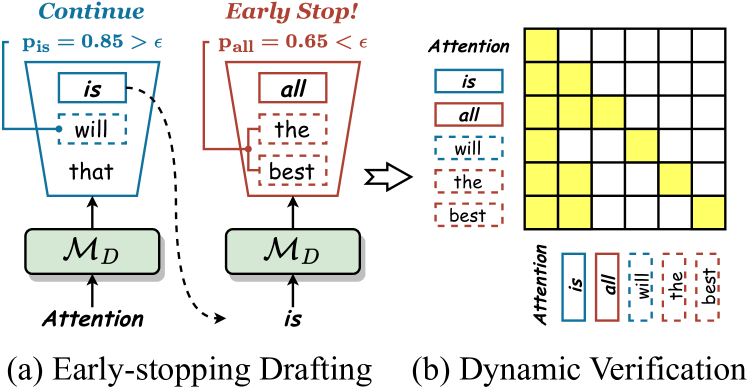
The image presents two diagrams illustrating "Early-stopping Drafting" and "Dynamic Verification" processes. The diagrams depict how attention mechanisms and probability thresholds influence the selection and verification of words in a sequence.
### Components/Axes
**Diagram (a): Early-stopping Drafting**
* **Title:** (a) Early-stopping Drafting
* **Top-Left Text:** Continue
* **Probability Condition:** p_is = 0.85 > ε
* **Input:** Attention (arrow pointing upwards to M_D)
* **Module:** M_D (green rounded rectangle)
* **Output Sequence (Blue):**
* "is" (solid blue rectangle)
* "will" (dashed blue rectangle)
* "that" (no rectangle)
* **Dashed Arrow:** A curved dashed arrow originates from the "is" rectangle and points downwards and rightwards towards the "is" input of diagram (b).
**Diagram (b): Dynamic Verification**
* **Title:** (b) Dynamic Verification
* **Top-Right Text:** Early Stop!
* **Probability Condition:** p_all = 0.65 < ε
* **Input:** is (arrow pointing upwards to M_D)
* **Module:** M_D (green rounded rectangle)
* **Output Sequence (Red):**
* "all" (solid red rectangle)
* "the" (dashed red rectangle)
* "best" (dashed red rectangle)
* **Arrow:** A right-pointing arrow connects the output sequence of diagram (a) to the attention matrix in diagram (b).
**Attention Matrix**
* A 6x6 grid representing an attention matrix.
* Rows correspond to the words "is", "all", "will", "the", "best".
* Columns correspond to the words "is", "all", "will", "the", "best".
* Cells are either yellow (indicating attention) or white (no attention).
**Attention Labels**
* **Vertical Attention Labels:** "Attention" written vertically.
* "is" (solid blue rectangle)
* "all" (solid red rectangle)
* "will" (dashed blue rectangle)
* "the" (dashed red rectangle)
* "best" (dashed red rectangle)
* **Horizontal Attention Labels:** "Attention" written horizontally.
* "is" (solid blue rectangle)
* "all" (solid red rectangle)
* "will" (dashed blue rectangle)
* "the" (dashed red rectangle)
* "best" (dashed red rectangle)
### Detailed Analysis
**Diagram (a): Early-stopping Drafting**
* The process starts with an "Attention" input to the module M_D.
* If the probability p_is for the word "is" is greater than a threshold ε (0.85 > ε), the process continues.
* The output sequence includes "is" (solid blue), "will" (dashed blue), and "that".
**Diagram (b): Dynamic Verification**
* The process starts with the word "is" as input to the module M_D.
* If the probability p_all for the word "all" is less than a threshold ε (0.65 < ε), the process stops early.
* The output sequence includes "all" (solid red), "the" (dashed red), and "best" (dashed red).
**Attention Matrix**
* The attention matrix shows the relationships between the words.
* The yellow cells indicate where attention is focused.
* Row 1 ("is"): Attends to column 1 ("is") and column 2 ("all").
* Row 2 ("all"): Attends to column 1 ("is") and column 2 ("all").
* Row 3 ("will"): Attends to column 3 ("will") and column 4 ("the").
* Row 4 ("the"): Attends to column 3 ("will") and column 4 ("the").
* Row 5 ("best"): Attends to column 5 ("best") and column 6 ("<end of sequence>").
### Key Observations
* The diagrams illustrate two different strategies for sequence generation: early-stopping and dynamic verification.
* Early-stopping is based on a probability threshold for a specific word ("is").
* Dynamic verification is based on a probability threshold for another word ("all").
* The attention matrix visualizes the relationships between the words in the sequence.
* Solid rectangles indicate words that are directly considered, while dashed rectangles indicate words that are potentially considered or predicted.
### Interpretation
The diagrams demonstrate how attention mechanisms and probability thresholds can be used to control the generation of sequences. Early-stopping allows the process to terminate if a certain condition is met, while dynamic verification allows the process to adapt based on the relationships between the words. The attention matrix provides a visual representation of these relationships, showing which words are most relevant to each other. The use of solid and dashed rectangles highlights the distinction between definite and potential word selections, adding a layer of nuance to the process. The probability thresholds (0.85 and 0.65) suggest a trade-off between accuracy and efficiency, where higher thresholds may lead to more accurate sequences but also require more computation.