## Box Plot: Accuracy vs. Number of Reasoning Steps for GPT-3.5 and Our Model
### Overview
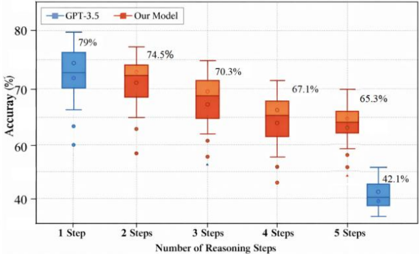
The image is a box plot comparing the accuracy of GPT-3.5 and "Our Model" across different numbers of reasoning steps (1 to 5). The y-axis represents accuracy in percentage, and the x-axis represents the number of reasoning steps. The plot shows the distribution of accuracy for each model at each step count.
### Components/Axes
* **Title:** Implicit, but the plot compares accuracy vs. reasoning steps.
* **X-axis:** "Number of Reasoning Steps" with categories: 1 Step, 2 Steps, 3 Steps, 4 Steps, 5 Steps.
* **Y-axis:** "Accuracy (%)" with a scale from approximately 40% to 80%.
* **Legend:** Located at the top-left of the chart.
* Blue: GPT-3.5
* Red/Orange: Our Model
### Detailed Analysis
The plot displays box plots for each model at each step. The box represents the interquartile range (IQR), the line inside the box represents the median, and the whiskers extend to the data points within 1.5 times the IQR. Points outside the whiskers are plotted as outliers.
**GPT-3.5:**
* **1 Step:** The box plot is centered around 73% accuracy, with a median around 74%. The top of the box is near 76%, and the bottom of the box is near 71%. The maximum value is near 79%. There is one outlier at approximately 60%.
* **5 Steps:** The box plot is centered around 40% accuracy, with a median around 41%. The top of the box is near 43%, and the bottom of the box is near 38%. The maximum value is near 42.1%.
**Our Model:**
* **2 Steps:** The box plot is centered around 72% accuracy, with a median around 73%. The top of the box is near 75%, and the bottom of the box is near 69%. The maximum value is near 74.5%. There is one outlier at approximately 58%.
* **3 Steps:** The box plot is centered around 69% accuracy, with a median around 70%. The top of the box is near 72%, and the bottom of the box is near 65%. The maximum value is near 70.3%. There is one outlier at approximately 57%.
* **4 Steps:** The box plot is centered around 65% accuracy, with a median around 66%. The top of the box is near 68%, and the bottom of the box is near 62%. The maximum value is near 67.1%. There is one outlier at approximately 53%.
* **5 Steps:** The box plot is centered around 63% accuracy, with a median around 64%. The top of the box is near 66%, and the bottom of the box is near 60%. The maximum value is near 65.3%. There is one outlier at approximately 59%.
### Key Observations
* GPT-3.5 has a significantly higher accuracy with 1 step compared to 5 steps.
* "Our Model" consistently decreases in accuracy as the number of reasoning steps increases.
* "Our Model" outperforms GPT-3.5 at 2, 3, 4 and 5 steps.
* The spread of accuracy (IQR) for "Our Model" appears to be relatively consistent across different numbers of reasoning steps.
### Interpretation
The data suggests that GPT-3.5 is more accurate with fewer reasoning steps, while "Our Model" shows a gradual decline in accuracy as the number of reasoning steps increases. "Our Model" consistently outperforms GPT-3.5 at 2, 3, 4 and 5 steps. This could indicate that "Our Model" is better suited for complex reasoning tasks, but its performance degrades as the complexity increases. The outliers in both models suggest that there are instances where the models perform significantly worse than their average performance. The box plot provides a visual representation of the distribution of accuracy for each model at each step count, allowing for a comparison of their performance.