## Diagram: State Transition Diagrams
### Overview
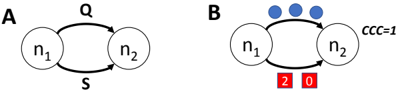
The image presents two state transition diagrams, labeled A and B. Each diagram depicts transitions between two states, represented as circles labeled n1 and n2. Diagram B includes additional annotations indicating counts or values associated with the transitions.
### Components/Axes
**Diagram A:**
* **Nodes:** Two nodes labeled "n1" and "n2".
* **Transitions:** Two directed edges (arrows) connecting n1 and n2.
* One edge from n1 to n2, labeled "Q".
* One edge from n2 to n1, labeled "s".
**Diagram B:**
* **Nodes:** Two nodes labeled "n1" and "n2".
* **Transitions:** Two directed edges (arrows) connecting n1 and n2.
* One edge from n1 to n2.
* One edge from n2 to n1.
* **Annotations:**
* Three blue circles above the edge from n1 to n2.
* Two red squares below the edges, labeled "2" (below the edge from n2 to n1) and "0" (below the edge from n1 to n2).
* Text "CCC = 1" to the right of node n2.
### Detailed Analysis or ### Content Details
**Diagram A:**
* Node n1 transitions to node n2 via transition Q.
* Node n2 transitions to node n1 via transition s.
**Diagram B:**
* Node n1 transitions to node n2, with an implied count of 3 (represented by the three blue circles).
* Node n2 transitions to node n1, with a count of 2 (represented by the red square labeled "2").
* Node n1 transitions to node n2, with a count of 0 (represented by the red square labeled "0").
* The "CCC" value for the diagram is 1.
### Key Observations
* Diagram A represents a basic state transition with symbolic labels for the transitions.
* Diagram B represents a state transition with counts or values associated with the transitions.
* The blue circles and red squares in Diagram B appear to represent different types of counts or values.
### Interpretation
The diagrams illustrate state transitions between two states, n1 and n2. Diagram A provides a basic representation with symbolic labels for the transitions, while Diagram B adds quantitative information in the form of counts or values associated with each transition. The "CCC = 1" annotation in Diagram B likely represents a characteristic or property of the overall transition system. The blue circles and red squares likely represent different types of counts or values associated with the transitions. The values 2 and 0 are associated with the transitions from n2 to n1 and n1 to n2, respectively. The three blue circles above the edge from n1 to n2 likely represent a count of 3 for that transition.