\n
## Diagram: State Transition Diagram
### Overview
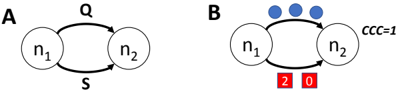
The image presents two state transition diagrams, labeled A and B, depicting relationships between two states, n1 and n2. Diagram A shows a simple bidirectional transition, while Diagram B includes additional elements representing a constraint and numerical values associated with the transitions.
### Components/Axes
* **Diagram A:**
* States: n1, n2 (represented as circles)
* Transitions: Bidirectional arrows connecting n1 and n2.
* Labels: "Q" above the transition from n1 to n2, "S" below the transition from n2 to n1.
* **Diagram B:**
* States: n1, n2 (represented as circles)
* Transitions: Bidirectional arrows connecting n1 and n2.
* Constraint: Three blue circles positioned above the transition arrows.
* Numerical Values: "2" below n1 and "0" below n2, enclosed in red boxes.
* Label: "CCC=1" to the right of n2.
### Detailed Analysis or Content Details
* **Diagram A:** The diagram shows a simple bidirectional relationship between states n1 and n2. The transition from n1 to n2 is labeled "Q", and the transition from n2 to n1 is labeled "S". There are no numerical values or constraints indicated.
* **Diagram B:** This diagram also shows a bidirectional relationship between n1 and n2. However, it includes a constraint represented by three blue circles above the arrows. The state n1 is associated with the value "2", and n2 is associated with the value "0". The label "CCC=1" suggests a constraint or condition related to the system.
### Key Observations
* Diagram B introduces numerical values and a constraint not present in Diagram A.
* The numerical values "2" and "0" are directly associated with states n1 and n2, respectively.
* The constraint "CCC=1" might represent a condition that must be met for the transitions to occur or a property of the system.
* The blue circles above the arrows in Diagram B could represent a condition or a set of possible transitions.
### Interpretation
These diagrams likely represent a simplified model of a system with two states. Diagram A shows a basic interaction, while Diagram B adds complexity with constraints and numerical values. The values "2" and "0" could represent quantities, probabilities, or other relevant parameters. The constraint "CCC=1" suggests a specific condition that governs the system's behavior. The blue circles could represent possible states or events that influence the transitions between n1 and n2.
Without further context, it's difficult to determine the exact meaning of these diagrams. However, they likely represent a system where the transition between states is influenced by a constraint and is associated with specific numerical values. The diagrams could be used to model a chemical reaction, a biological process, or a computational system. The "Q" and "S" labels could represent specific actions or events that trigger the transitions.