## Line Chart: Test Accuracy vs. Number of Feedback Rounds
### Overview
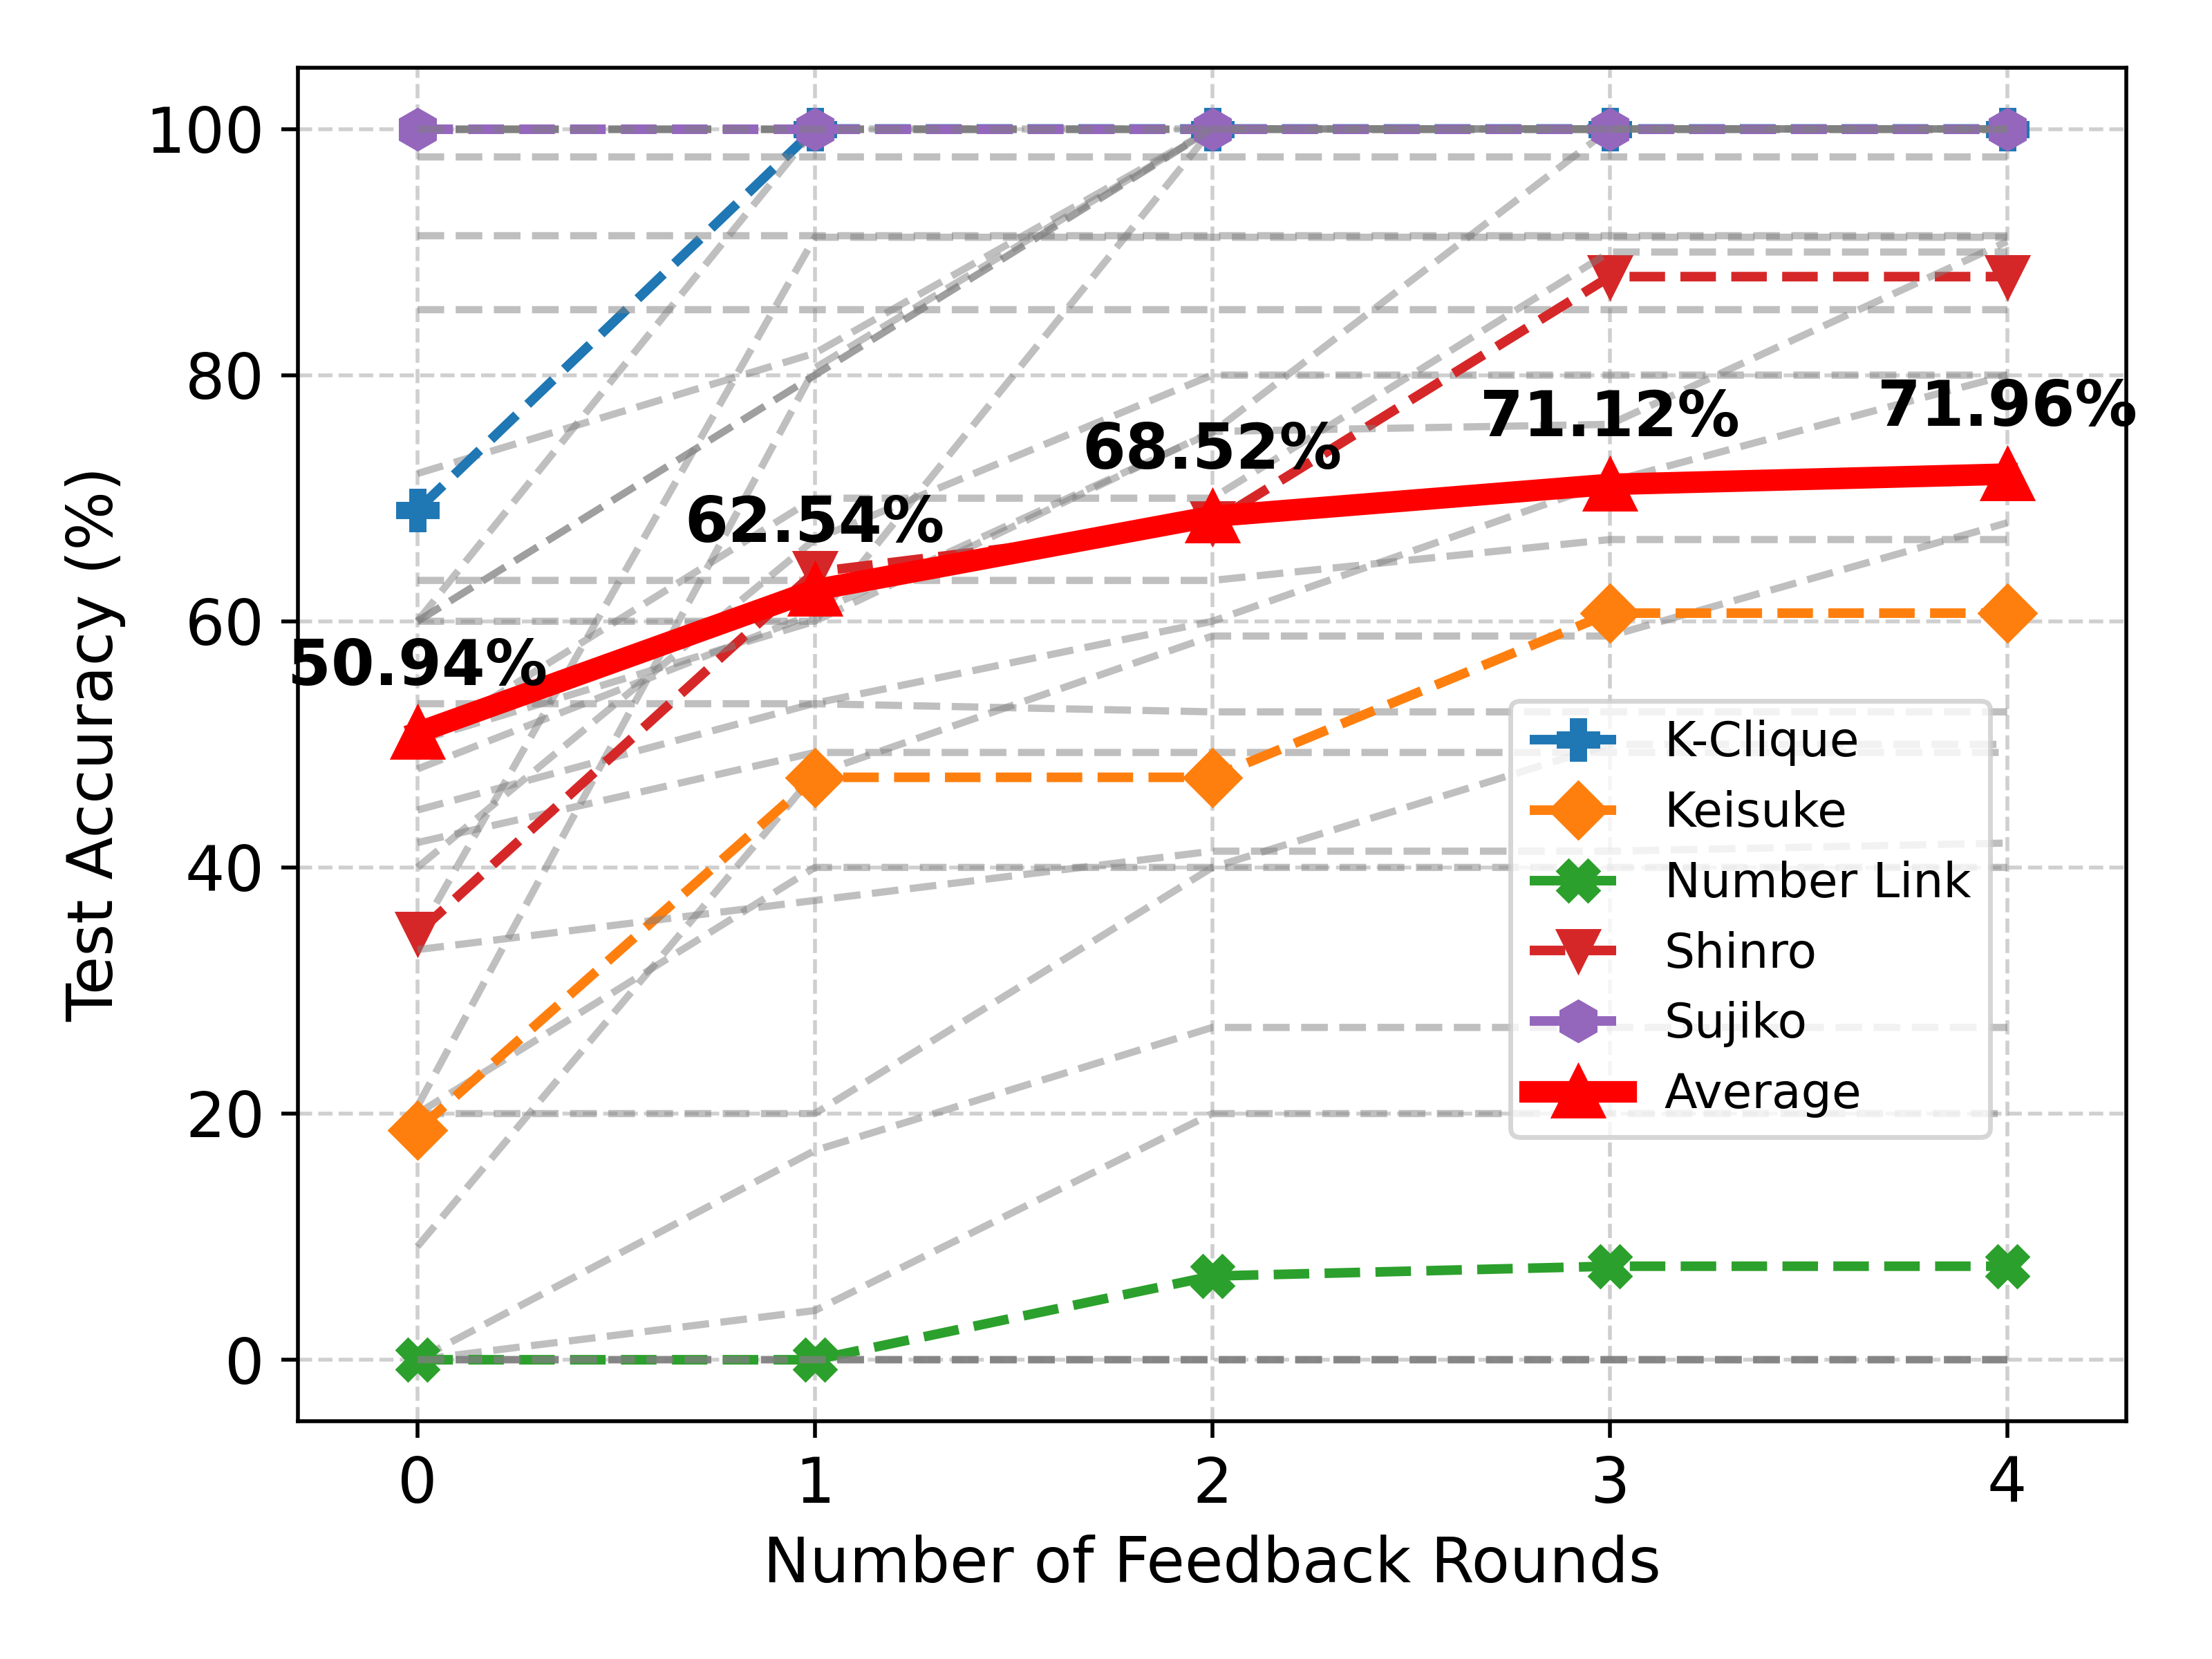
This is a line chart displaying the performance of five distinct tasks or models (K-Clique, Keisuke, Number Link, Shinro, Sujiko) and their average across 0 to 4 rounds of feedback. The chart plots "Test Accuracy (%)" on the vertical axis against the "Number of Feedback Rounds" on the horizontal axis. The primary visual narrative is one of improvement with additional feedback, though the starting points and rates of improvement vary significantly between tasks.
### Components/Axes
* **Y-Axis:** Labeled "Test Accuracy (%)". Scale runs from 0 to 100 in increments of 20, with gridlines at every 10% interval.
* **X-Axis:** Labeled "Number of Feedback Rounds". Discrete integer values from 0 to 4.
* **Legend:** Located in the bottom-right quadrant of the chart area. It defines six data series:
| Series | Line Style | Marker |
| :--- | :--- | :--- |
| **K-Clique** | Blue solid line | Plus (`+`) |
| **Keisuke** | Orange dashed line | Diamond |
| **Number Link** | Green dashed line | Cross (`x`) |
| **Shinro** | Red dashed line | Downward-pointing triangle |
| **Sujiko** | Purple solid line | Hexagon |
| **Average** | Thick, solid red line | Upward-pointing triangle |
### Detailed Analysis
**Data Series and Trends:**
1. **Sujiko (Purple, Hexagons):**
* **Trend:** Perfectly flat at the maximum value.
* **Data Points:** 100% at rounds 0, 1, 2, 3, and 4. This task appears to be solved perfectly from the outset.
2. **K-Clique (Blue, Plus Signs):**
* **Trend:** Sharp, near-vertical increase from round 0 to 1, then flat at the maximum.
* **Data Points:** Starts at approximately 70% at round 0. Jumps to 100% at round 1 and remains at 100% for rounds 2, 3, and 4.
3. **Shinro (Red, Downward Triangles):**
* **Trend:** Steady, strong upward slope that begins to plateau after round 3.
* **Data Points:**
| Round | Accuracy |
| :--- | :--- |
| 0 | ~35% |
| 1 | ~62.54% |
| 2 | ~68.52% |
| 3 | ~88% |
| 4 | ~88% |
4. **Keisuke (Orange, Diamonds):**
* **Trend:** Step-wise improvement. Increases from round 0 to 1, plateaus at round 2, then increases again at round 3 before plateauing.
* **Data Points:**
| Round | Accuracy |
| :--- | :--- |
| 0 | ~20% |
| 1 | ~48% |
| 2 | ~48% |
| 3 | ~60% |
| 4 | ~60% |
5. **Number Link (Green, Crosses):**
* **Trend:** Very low initial performance with minimal improvement.
* **Data Points:** Starts at 0% at round 0. Remains at 0% at round 1. Increases to approximately 8% at round 2 and remains at ~8% for rounds 3 and 4.
6. **Average (Thick Red, Upward Triangles):**
* **Trend:** Consistent, smooth upward curve showing diminishing returns. The slope is steepest initially and gradually flattens.
* **Labeled Data Points:**
| Round | Accuracy |
| :--- | :--- |
| 0 | **50.94%** |
| 1 | **62.54%** |
| 2 | **68.52%** |
| 3 | **71.12%** |
| 4 | **71.96%** |
### Key Observations
* **Performance Ceiling:** Two tasks (Sujiko, K-Clique) reach and maintain 100% accuracy, indicating they are fully solvable with the given feedback mechanism.
* **Performance Floor:** One task (Number Link) shows very poor performance (<10%) even after four feedback rounds, suggesting it is either extremely difficult or the feedback method is ineffective for it.
* **Feedback Efficacy:** The "Average" line demonstrates a clear positive correlation between feedback rounds and accuracy, with the most significant gains occurring in the first two rounds (a ~17.58 percentage point increase from round 0 to 2).
* **Variability:** There is high variability in task difficulty and responsiveness to feedback, as shown by the wide spread of lines from 0% to 100% at round 4.
### Interpretation
This chart likely evaluates an iterative learning or refinement system where a model receives feedback after each round to improve its performance on specific puzzle-like tasks (inferred from names like "Number Link" and "Sujiko").
The data suggests the feedback mechanism is highly effective for some tasks (K-Clique, Shinro) but has limited utility for others (Number Link). The "Average" line's trajectory is a classic learning curve, showing that while additional feedback continues to yield improvements, the marginal gain per round decreases. The stark contrast between tasks implies that the nature of the task itself is a primary determinant of both initial performance and the potential for improvement via feedback. The system appears to have successfully mastered a subset of the tasks (Sujiko, K-Clique) within the observed timeframe.