## Bar Chart: Drop in AUROC for Different Question Answering Datasets
### Overview
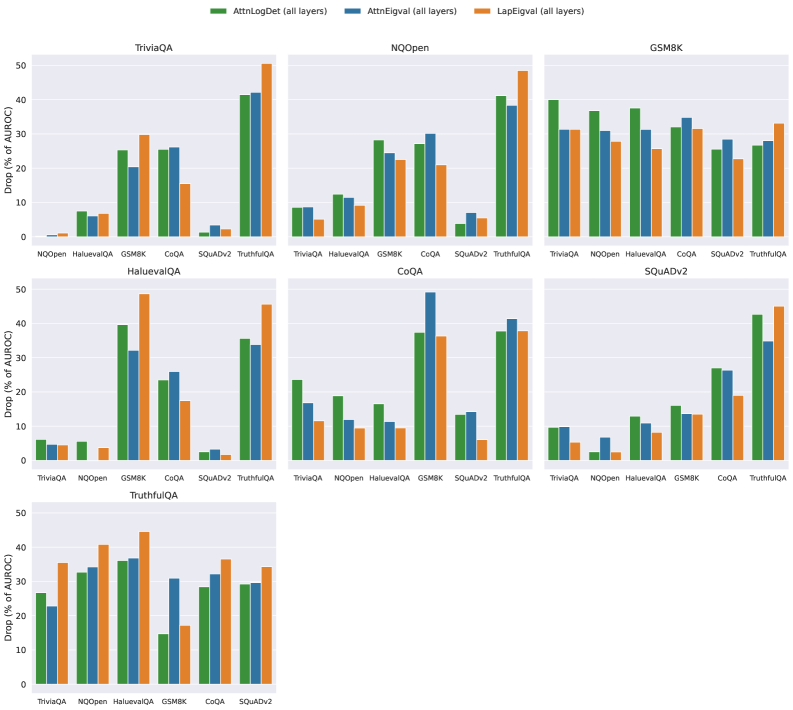
The image presents a series of bar charts comparing the drop in Area Under the Receiver Operating Characteristic curve (AUROC) for different question answering datasets when using three different methods: AttnLogDet, AttnEigval, and LapEigval. Each chart corresponds to a specific question answering dataset (TriviaQA, NQOpen, GSM8K, HaluevalQA, CoQA, SQuADv2, TruthfulQA). The x-axis represents different question answering datasets, and the y-axis represents the drop in AUROC, measured as a percentage.
### Components/Axes
* **Title:** The title is implied from the individual chart titles (TriviaQA, NQOpen, GSM8K, HaluevalQA, CoQA, SQuADv2, TruthfulQA).
* **Y-axis:** "Drop (% of AUROC)". The scale ranges from 0 to 50, with tick marks at 0, 10, 20, 30, 40, and 50.
* **X-axis:** The x-axis varies for each subplot, but contains a subset of the following datasets: NQOpen, HaluevalQA, GSM8K, CoQA, SQuADv2, TruthfulQA, TriviaQA.
* **Legend:** Located at the top of the image.
* Green: AttnLogDet (all layers)
* Blue: AttnEigval (all layers)
* Orange: LapEigval (all layers)
### Detailed Analysis
Each subplot represents a different question answering dataset. Within each subplot, the drop in AUROC is shown for different datasets using the three methods (AttnLogDet, AttnEigval, and LapEigval).
**TriviaQA**
* X-axis: NQOpen, HaluevalQA, GSM8K, CoQA, SQuADv2, TruthfulQA
* AttnLogDet (Green): Values are approximately: 1, 6, 32, 28, 1, 42
* AttnEigval (Blue): Values are approximately: 8, 6, 24, 28, 2, 42
* LapEigval (Orange): Values are approximately: 6, 6, 28, 28, 2, 50
**NQOpen**
* X-axis: TriviaQA, HaluevalQA, GSM8K, CoQA, SQuADv2, TruthfulQA
* AttnLogDet (Green): Values are approximately: 8, 12, 30, 20, 2, 40
* AttnEigval (Blue): Values are approximately: 10, 12, 32, 12, 4, 36
* LapEigval (Orange): Values are approximately: 10, 14, 36, 12, 2, 48
**GSM8K**
* X-axis: TriviaQA, NQOpen, HaluevalQA, CoQA, SQuADv2, TruthfulQA
* AttnLogDet (Green): Values are approximately: 42, 36, 36, 32, 28, 38
* AttnEigval (Blue): Values are approximately: 36, 36, 36, 34, 32, 34
* LapEigval (Orange): Values are approximately: 38, 38, 34, 30, 32, 32
**HaluevalQA**
* X-axis: TriviaQA, NQOpen, GSM8K, CoQA, SQuADv2, TruthfulQA
* AttnLogDet (Green): Values are approximately: 6, 6, 32, 24, 2, 36
* AttnEigval (Blue): Values are approximately: 6, 6, 32, 16, 2, 34
* LapEigval (Orange): Values are approximately: 6, 6, 48, 18, 2, 44
**CoQA**
* X-axis: TriviaQA, NQOpen, HaluevalQA, GSM8K, SQuADv2, TruthfulQA
* AttnLogDet (Green): Values are approximately: 20, 24, 14, 36, 12, 36
* AttnEigval (Blue): Values are approximately: 12, 12, 12, 48, 14, 38
* LapEigval (Orange): Values are approximately: 12, 12, 12, 36, 12, 36
**SQuADv2**
* X-axis: TriviaQA, NQOpen, HaluevalQA, GSM8K, CoQA, TruthfulQA
* AttnLogDet (Green): Values are approximately: 6, 2, 10, 10, 26, 42
* AttnEigval (Blue): Values are approximately: 6, 4, 10, 10, 24, 34
* LapEigval (Orange): Values are approximately: 6, 2, 10, 10, 24, 48
**TruthfulQA**
* X-axis: TriviaQA, NQOpen, HaluevalQA, GSM8K, CoQA, SQuADv2
* AttnLogDet (Green): Values are approximately: 26, 34, 38, 14, 32, 30
* AttnEigval (Blue): Values are approximately: 22, 36, 40, 14, 34, 28
* LapEigval (Orange): Values are approximately: 30, 42, 44, 18, 30, 30
### Key Observations
* The drop in AUROC varies significantly across different question answering datasets and methods.
* GSM8K generally shows a higher drop in AUROC compared to other datasets.
* SQuADv2 often shows the lowest drop in AUROC.
* The LapEigval method often results in a higher drop in AUROC compared to the other two methods, especially for TruthfulQA.
### Interpretation
The bar charts illustrate the performance degradation of different question answering models when evaluated on various datasets using different methods (AttnLogDet, AttnEigval, and LapEigval). The drop in AUROC indicates a decrease in the model's ability to accurately answer questions. The variations in performance across datasets and methods suggest that the models are more sensitive to certain types of questions or dataset characteristics. The higher drop in AUROC for GSM8K might indicate that these methods are less effective for mathematical reasoning tasks. The LapEigval method's tendency to result in a higher drop in AUROC could imply that it is more susceptible to adversarial attacks or noise in the data.