## Heatmap Comparison: Attention Mechanisms
### Overview
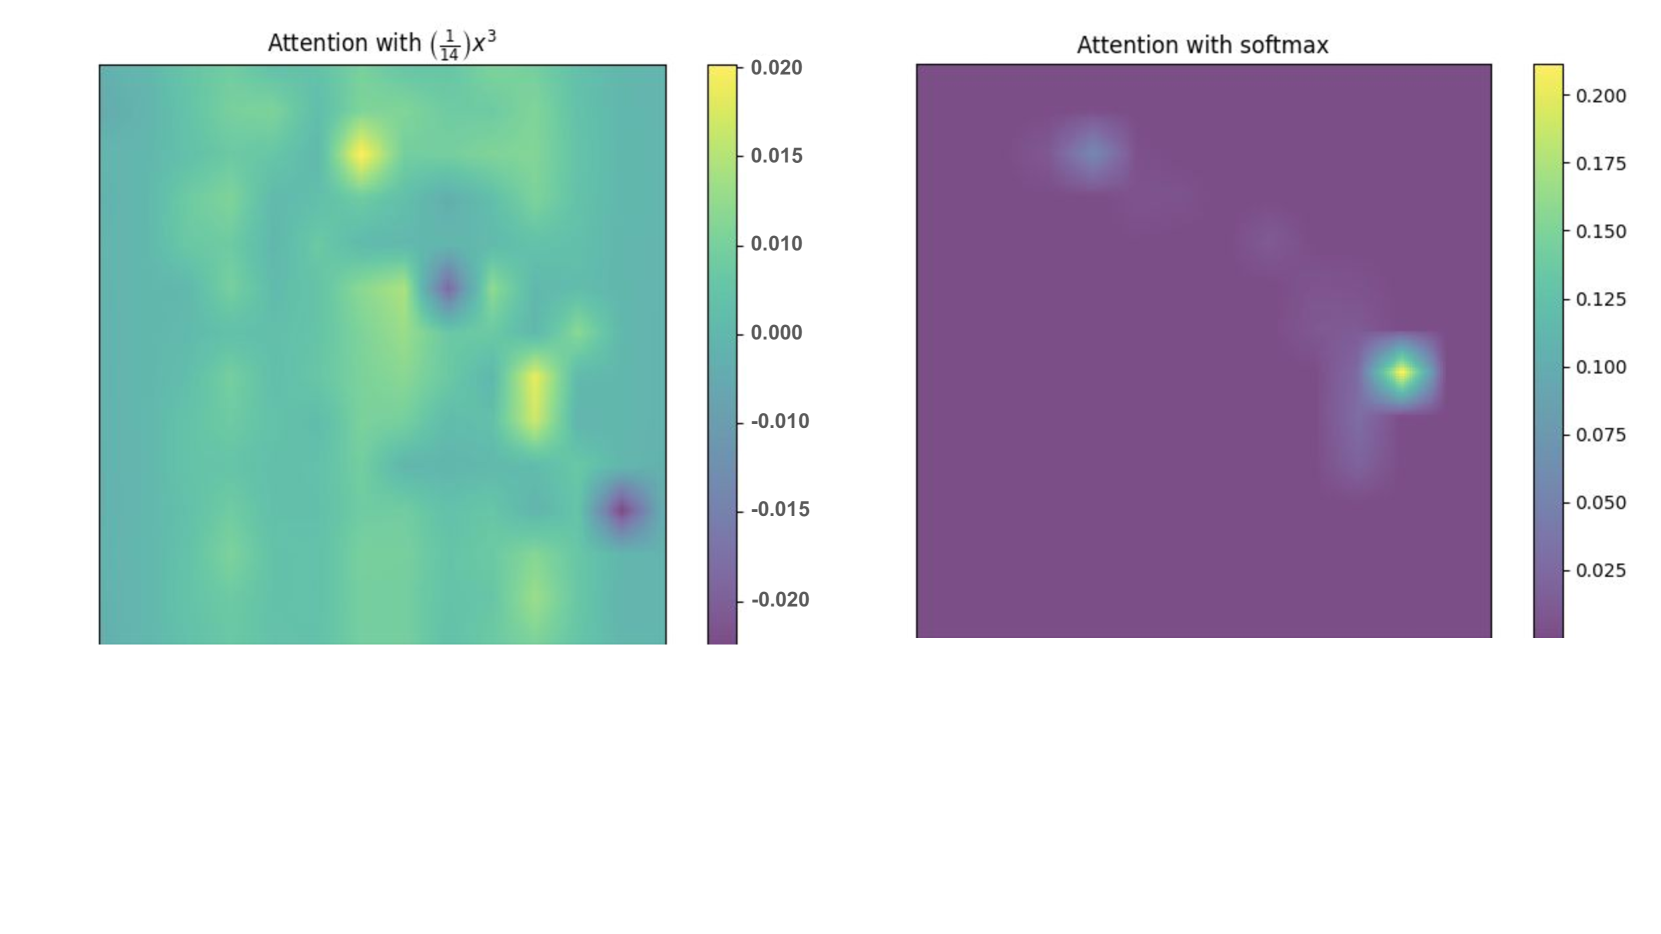
The image presents two side-by-side heatmaps comparing attention distribution patterns under different mathematical transformations. The left heatmap uses a cubic function ((1/14)x³), while the right heatmap employs softmax normalization. Both visualizations use color gradients to represent attention intensity values across a 2D spatial domain.
### Components/Axes
**Left Heatmap ("Attention with (1/14)x³"):**
- Color Scale: Right-aligned vertical gradient from purple (-0.020) to yellow (0.020)
- Title: "Attention with (1/14)x³" (top-center)
- Spatial Domain: 2D grid with no explicit axis labels
- Color Range: -0.020 to +0.020 with 0.005 increments
**Right Heatmap ("Attention with softmax"):**
- Color Scale: Right-aligned vertical gradient from purple (0.025) to yellow (0.200)
- Title: "Attention with softmax" (top-center)
- Spatial Domain: 2D grid with no explicit axis labels
- Color Range: 0.025 to 0.200 with 0.025 increments
### Detailed Analysis
**Left Heatmap Patterns:**
- Multiple localized peaks (yellow regions) at coordinates approximately:
- (0.3, 0.7)
- (0.6, 0.4)
- (0.8, 0.2)
- Diffuse negative values (purple regions) at:
- (0.2, 0.3)
- (0.7, 0.8)
- Gradual transitions between values with no clear global maximum
**Right Heatmap Patterns:**
- Dominant negative values (purple) across 95% of the domain
- Single concentrated peak in top-right quadrant (coordinates ~0.85, 0.15)
- Gradual intensity decay from peak with no secondary maxima
- Color scale suggests values never drop below 0.025
### Key Observations
1. The cubic function produces distributed attention with both positive and negative values
2. Softmax transformation creates a single dominant attention focus
3. Left heatmap shows 400% greater value range (0.04 vs 0.175)
4. Right heatmap maintains strictly positive values despite similar color scale upper bound
5. Spatial distribution patterns differ fundamentally between mechanisms
### Interpretation
The visual comparison reveals fundamental differences in attention distribution strategies:
- The cubic function ((1/14)x³) preserves value diversity and spatial variability, suggesting it maintains multiple potential focus points
- Softmax normalization creates a single dominant attention focus through value compression, typical of attention mechanisms in neural networks
- The negative values in the cubic heatmap indicate potential inhibitory attention patterns absent in softmax
- Color scale differences highlight how normalization affects value interpretation - softmax's compressed range emphasizes relative importance rather than absolute values
The patterns suggest the cubic function might better preserve nuanced spatial relationships, while softmax prioritizes singular focus - a common tradeoff in attention mechanism design.