## Bar Charts: VRAM Usage and Average Accuracy vs. Number of Parameters
### Overview
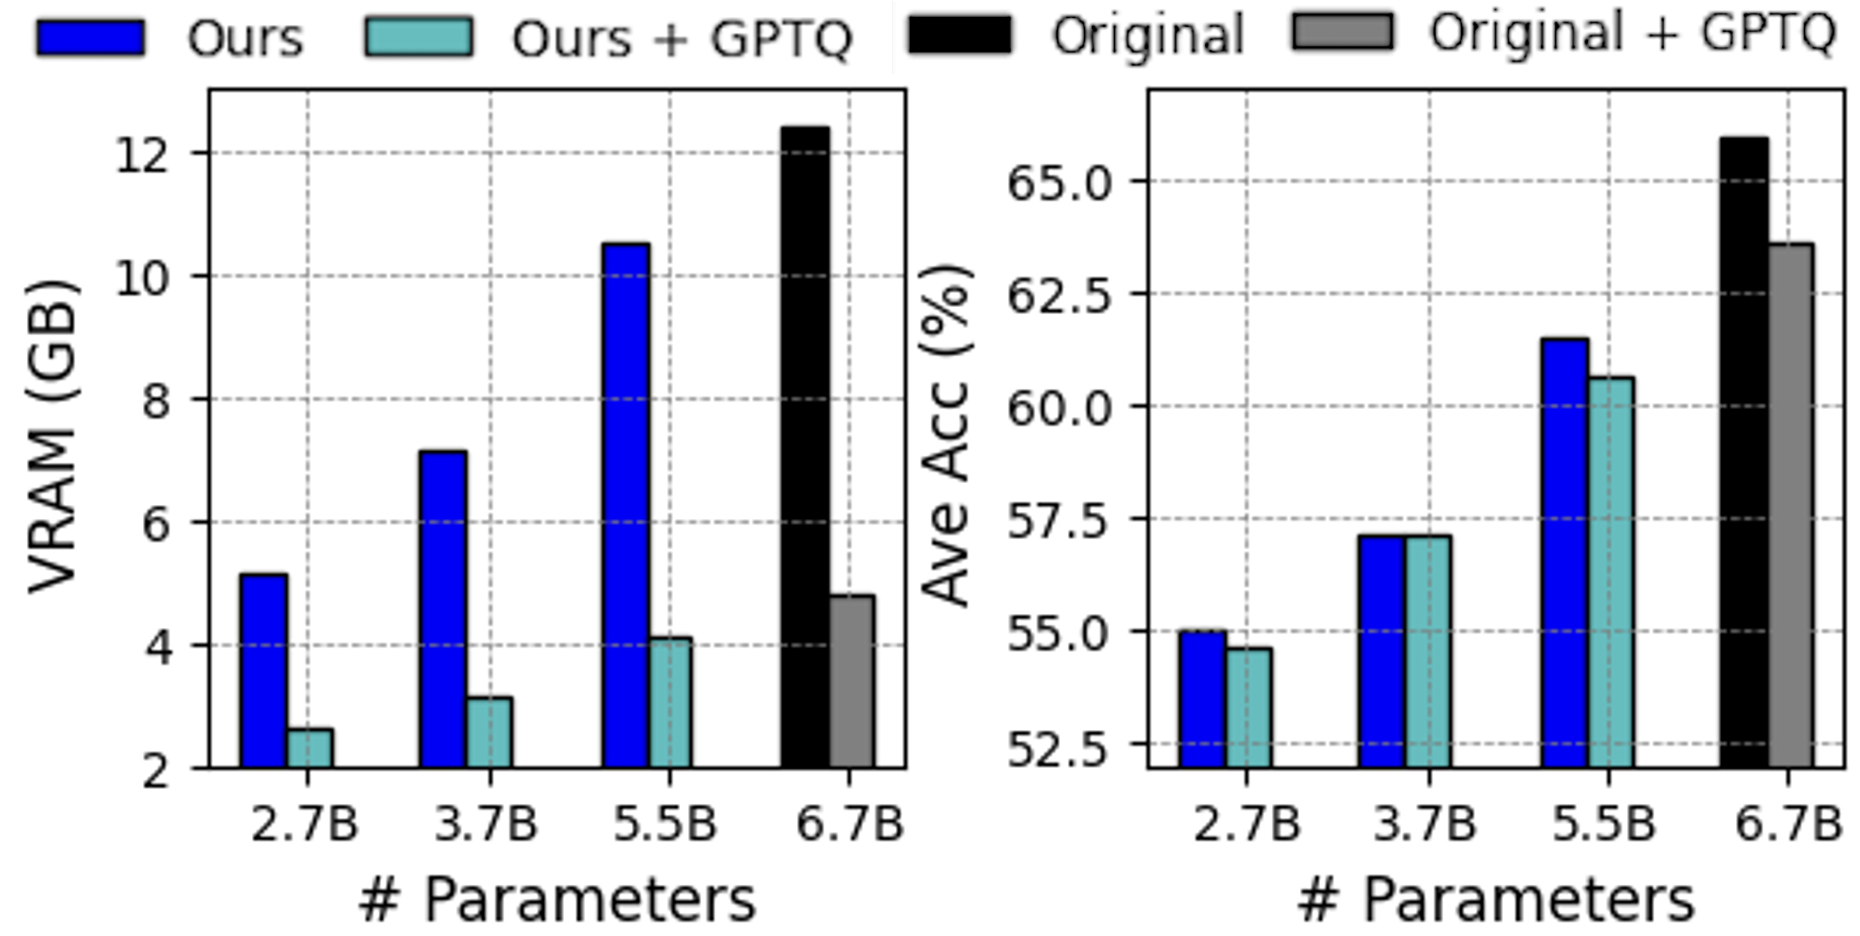
The image presents two bar charts side-by-side. The left chart displays VRAM usage (in GB) as a function of the number of parameters, while the right chart shows the average accuracy (in %) as a function of the number of parameters. Both charts compare four different configurations: "Ours", "Ours + GPTQ", "Original", and "Original + GPTQ". The x-axis for both charts represents the number of parameters, with values at 2.7B, 3.7B, 5.5B, and 6.7B.
### Components/Axes
**Left Chart (VRAM Usage):**
* **Y-axis:** VRAM (GB), ranging from 2 to 12 in increments of 2.
* **X-axis:** # Parameters, with values 2.7B, 3.7B, 5.5B, and 6.7B.
* **Legend:** Located at the top of the image.
* Blue: Ours
* Teal: Ours + GPTQ
* Black: Original
* Gray: Original + GPTQ
**Right Chart (Average Accuracy):**
* **Y-axis:** Ave Acc (%), ranging from 52.5 to 65.0 in increments of 2.5.
* **X-axis:** # Parameters, with values 2.7B, 3.7B, 5.5B, and 6.7B.
* **Legend:** (Same as left chart, located at the top of the image).
* Blue: Ours
* Teal: Ours + GPTQ
* Black: Original
* Gray: Original + GPTQ
### Detailed Analysis
**Left Chart (VRAM Usage):**
* **Ours (Blue):** VRAM usage increases with the number of parameters.
* 2.7B: ~5.2 GB
* 3.7B: ~7.2 GB
* 5.5B: ~10.5 GB
* 6.7B: Not present
* **Ours + GPTQ (Teal):** VRAM usage also increases with the number of parameters, but at a much lower rate than "Ours".
* 2.7B: ~2.7 GB
* 3.7B: ~3.1 GB
* 5.5B: ~4.1 GB
* 6.7B: Not present
* **Original (Black):** VRAM usage is only present for 6.7B parameters.
* 6.7B: ~12.3 GB
* **Original + GPTQ (Gray):** VRAM usage is only present for 6.7B parameters.
* 6.7B: ~4.9 GB
**Right Chart (Average Accuracy):**
* **Ours (Blue):** Average accuracy increases with the number of parameters.
* 2.7B: ~55.0 %
* 3.7B: ~57.3 %
* 5.5B: ~61.3 %
* 6.7B: Not present
* **Ours + GPTQ (Teal):** Average accuracy increases with the number of parameters, and is slightly lower than "Ours".
* 2.7B: ~54.7 %
* 3.7B: ~56.8 %
* 5.5B: ~60.1 %
* 6.7B: Not present
* **Original (Black):** Average accuracy is only present for 6.7B parameters.
* 6.7B: ~65.5 %
* **Original + GPTQ (Gray):** Average accuracy is only present for 6.7B parameters.
* 6.7B: ~63.7 %
### Key Observations
* For both charts, the "Ours" and "Ours + GPTQ" configurations have data for 2.7B, 3.7B, and 5.5B parameters, while "Original" and "Original + GPTQ" only have data for 6.7B parameters.
* GPTQ significantly reduces VRAM usage compared to the original configurations.
* The "Original" configuration has the highest average accuracy at 6.7B parameters, but also the highest VRAM usage.
* Applying GPTQ to "Original" reduces VRAM usage while only slightly decreasing average accuracy.
### Interpretation
The data suggests that GPTQ (GPT Quantization) is an effective technique for reducing VRAM usage in models, as evidenced by the lower VRAM consumption of "Ours + GPTQ" compared to "Ours", and "Original + GPTQ" compared to "Original". The trade-off is a slight decrease in average accuracy when using GPTQ. The "Original" model with 6.7B parameters achieves the highest accuracy, but at the cost of significantly higher VRAM usage. This information is valuable for model optimization, allowing users to balance accuracy and memory footprint based on their specific needs and hardware constraints. The absence of data for "Original" and "Original + GPTQ" at lower parameter counts limits a full comparison across all configurations.