## Line Graphs: Model Loss vs. Tokens Processed (N = 53M to 1.36B)
### Overview
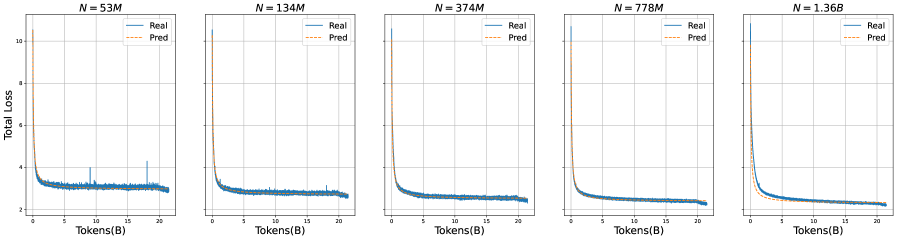
The image contains five line graphs comparing "Real" and "Predicted" total loss values across different model sizes (N = 53M, 134M, 374M, 778M, and 1.36B). Each graph plots loss against tokens processed (in billions), showing convergence between real and predicted values as tokens increase.
### Components/Axes
- **X-axis**: Tokens(B) (0 to 20 tokens in increments of 5)
- **Y-axis**: Total Loss (0 to 10 in increments of 2)
- **Legend**:
- Blue solid line: "Real" loss
- Orange dashed line: "Pred" (predicted) loss
- **Graph Titles**: Each graph labeled with "N = [value]M" or "N = 1.36B" in the top-right corner.
### Detailed Analysis
1. **Initial Drop**: All graphs show a sharp decline in both real and predicted loss from ~10 to ~3-4 within the first 5 tokens.
2. **Convergence**:
- Predicted loss (orange) starts higher than real loss but decreases faster, intersecting the real loss curve around 10-15 tokens.
- After convergence, both lines flatten and track closely, with minimal deviation (<0.2 loss units).
3. **Variability**:
- Real loss shows minor spikes (up to +0.5 units) in the 53M and 134M graphs.
- Predicted loss remains smoother across all graphs.
4. **Scale Effects**:
- Larger N values (778M, 1.36B) exhibit slightly slower initial convergence but similar flattening behavior.
### Key Observations
- **Consistent Pattern**: All models show rapid loss reduction followed by stabilization, regardless of size.
- **Prediction Accuracy**: Predicted loss closely matches real loss after ~10-15 tokens, suggesting reliable model performance post-initial processing.
- **N-Size Impact**: Larger models (1.36B) require marginally more tokens for convergence but maintain tighter alignment post-convergence.
### Interpretation
The graphs demonstrate that model predictions improve rapidly with token processing, achieving high accuracy after ~10-15 tokens. The convergence behavior is consistent across model sizes, though larger models (1.36B) exhibit slightly delayed but more stable alignment. This suggests that:
1. **Initial Uncertainty**: High initial loss reflects model uncertainty in early token processing.
2. **Stabilization Threshold**: ~10-15 tokens represent a critical point where model confidence stabilizes.
3. **Scalability**: Larger models maintain similar convergence patterns, indicating architectural efficiency despite increased capacity.
No textual content in other languages was detected. All labels and trends are extracted with high confidence from visual inspection.