## Line Chart: Accuracy vs. Sample Size
### Overview
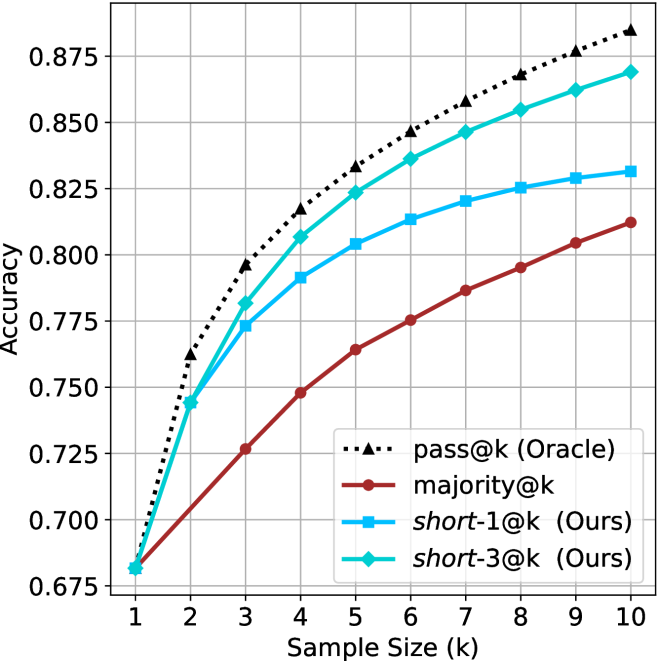
The image is a line chart comparing the accuracy of different methods ("pass@k (Oracle)", "majority@k", "short-1@k (Ours)", and "short-3@k (Ours)") as a function of sample size (k). The chart shows how accuracy increases with sample size for each method.
### Components/Axes
* **X-axis:** Sample Size (k), ranging from 1 to 10.
* **Y-axis:** Accuracy, ranging from 0.675 to 0.875, with increments of 0.025.
* **Legend:** Located in the bottom-center of the chart, identifying each line by color and marker:
* Black dotted line with triangle markers: pass@k (Oracle)
* Brown line with circle markers: majority@k
* Blue line with square markers: short-1@k (Ours)
* Cyan line with diamond markers: short-3@k (Ours)
### Detailed Analysis
* **pass@k (Oracle):** The black dotted line with triangle markers represents this method. The trend is upward, with a steep initial increase, followed by a gradual flattening.
* k=1: Accuracy ≈ 0.68
* k=2: Accuracy ≈ 0.77
* k=3: Accuracy ≈ 0.82
* k=10: Accuracy ≈ 0.88
* **majority@k:** The brown line with circle markers represents this method. The trend is upward, with a relatively linear increase.
* k=1: Accuracy ≈ 0.68
* k=2: Accuracy ≈ 0.72
* k=5: Accuracy ≈ 0.77
* k=10: Accuracy ≈ 0.81
* **short-1@k (Ours):** The blue line with square markers represents this method. The trend is upward, with a steep initial increase, followed by a gradual flattening.
* k=1: Accuracy ≈ 0.68
* k=2: Accuracy ≈ 0.74
* k=5: Accuracy ≈ 0.81
* k=10: Accuracy ≈ 0.83
* **short-3@k (Ours):** The cyan line with diamond markers represents this method. The trend is upward, with a steep initial increase, followed by a gradual flattening.
* k=1: Accuracy ≈ 0.68
* k=2: Accuracy ≈ 0.75
* k=5: Accuracy ≈ 0.83
* k=10: Accuracy ≈ 0.87
### Key Observations
* All methods show an increase in accuracy as the sample size (k) increases.
* The "pass@k (Oracle)" method consistently achieves the highest accuracy across all sample sizes.
* The "majority@k" method consistently achieves the lowest accuracy across all sample sizes.
* The "short-3@k (Ours)" method performs better than "short-1@k (Ours)" across all sample sizes.
* The rate of increase in accuracy diminishes as the sample size increases, especially for "pass@k (Oracle)", "short-1@k (Ours)", and "short-3@k (Ours)".
### Interpretation
The chart demonstrates the relationship between sample size and accuracy for different methods. The "pass@k (Oracle)" method serves as an upper bound or ideal performance, while the other methods ("majority@k", "short-1@k (Ours)", and "short-3@k (Ours)") show varying degrees of improvement with increasing sample size. The "majority@k" method appears to be the least effective. The "short-1@k (Ours)" and "short-3@k (Ours)" methods show significant improvement over "majority@k", with "short-3@k (Ours)" approaching the performance of "pass@k (Oracle)" at larger sample sizes. The flattening of the curves suggests that there are diminishing returns to increasing the sample size beyond a certain point. The data suggests that the "short-3@k (Ours)" method is a promising approach, as it achieves relatively high accuracy with increasing sample size.