## Line Chart: Accuracy vs. Sample Size (k)
### Overview
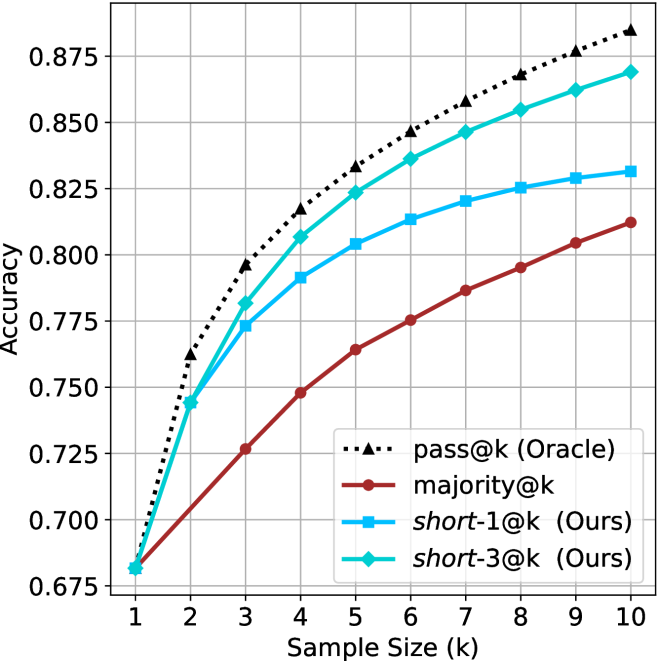
This image is a line chart illustrating the performance (Accuracy) of four different evaluation methods across varying sample sizes (k), ranging from 1 to 10. The chart demonstrates how accuracy improves as the sample size increases for all methods, with distinct performance gaps between the strategies.
### Components/Axes
* **X-Axis:** Labeled "Sample Size (k)". The scale is linear, marked with integers from 1 to 10.
* **Y-Axis:** Labeled "Accuracy". The scale ranges from 0.675 to 0.875, with major grid lines at intervals of 0.025.
* **Legend:** Positioned in the bottom-right quadrant of the chart area.
* **Black dotted line with triangle markers:** `pass@k (Oracle)`
* **Dark red solid line with circle markers:** `majority@k`
* **Light blue solid line with square markers:** `short-1@k (Ours)`
* **Cyan solid line with diamond markers:** `short-3@k (Ours)`
### Detailed Analysis
**Trend Verification:** All four data series exhibit a positive correlation between sample size and accuracy. The curves follow a logarithmic-style growth pattern, where the rate of accuracy improvement is steepest between k=1 and k=3, and gradually flattens as k approaches 10. All lines originate from a single point at k=1.
**Data Point Extraction (Approximate Values):**
| Sample Size (k) | pass@k (Oracle) | short-3@k (Ours) | short-1@k (Ours) | majority@k |
| :--- | :--- | :--- | :--- | :--- |
| **1** | ~0.682 | ~0.682 | ~0.682 | ~0.682 |
| **2** | ~0.762 | ~0.744 | ~0.744 | ~0.705 |
| **3** | ~0.796 | ~0.782 | ~0.773 | ~0.727 |
| **4** | ~0.817 | ~0.807 | ~0.792 | ~0.748 |
| **5** | ~0.833 | ~0.823 | ~0.804 | ~0.764 |
| **6** | ~0.846 | ~0.836 | ~0.813 | ~0.775 |
| **7** | ~0.858 | ~0.846 | ~0.820 | ~0.787 |
| **8** | ~0.868 | ~0.855 | ~0.825 | ~0.795 |
| **9** | ~0.876 | ~0.862 | ~0.829 | ~0.805 |
| **10** | ~0.884 | ~0.869 | ~0.831 | ~0.812 |
*Note: Values are estimated based on visual position relative to the grid lines.*
### Key Observations
* **Convergence:** At k=1, all four methods have identical accuracy (~0.682).
* **Performance Hierarchy:** The `pass@k (Oracle)` method consistently provides the highest accuracy across all sample sizes > 1. The `short-3@k (Ours)` method is the second most effective, followed by `short-1@k (Ours)`, with `majority@k` consistently performing the worst.
* **Divergence:** The performance gap between the methods widens significantly as the sample size increases. For example, at k=10, the gap between the Oracle and the Majority method is approximately 0.072 (0.884 - 0.812).
* **Diminishing Returns:** The slope of all lines decreases as k increases, indicating that adding more samples provides diminishing returns in accuracy.
### Interpretation
This chart likely represents an evaluation of code generation or classification models.
* **The "Oracle" Baseline:** The `pass@k (Oracle)` represents the theoretical upper bound of performance, likely defined as "if any of the k samples are correct, the result is correct."
* **"Ours" vs. "Majority":** The "Ours" methods (`short-1` and `short-3`) are clearly superior to the standard `majority@k` voting strategy. This suggests that the authors have developed a filtering or ranking mechanism that selects better candidates from the generated samples than a simple majority vote.
* **short-3 vs. short-1:** The fact that `short-3` outperforms `short-1` suggests that the proposed method benefits from having a slightly larger pool of candidates to select from, or that the ranking mechanism is more robust when considering the top 3 candidates rather than just the top 1.
* **Practical Implication:** The data demonstrates that for this specific task, using the authors' proposed methods allows for significantly higher accuracy than standard majority voting, approaching the theoretical Oracle limit more closely.