## Bar Chart: Latency vs. Batch Size for FP16 and w8a8
### Overview
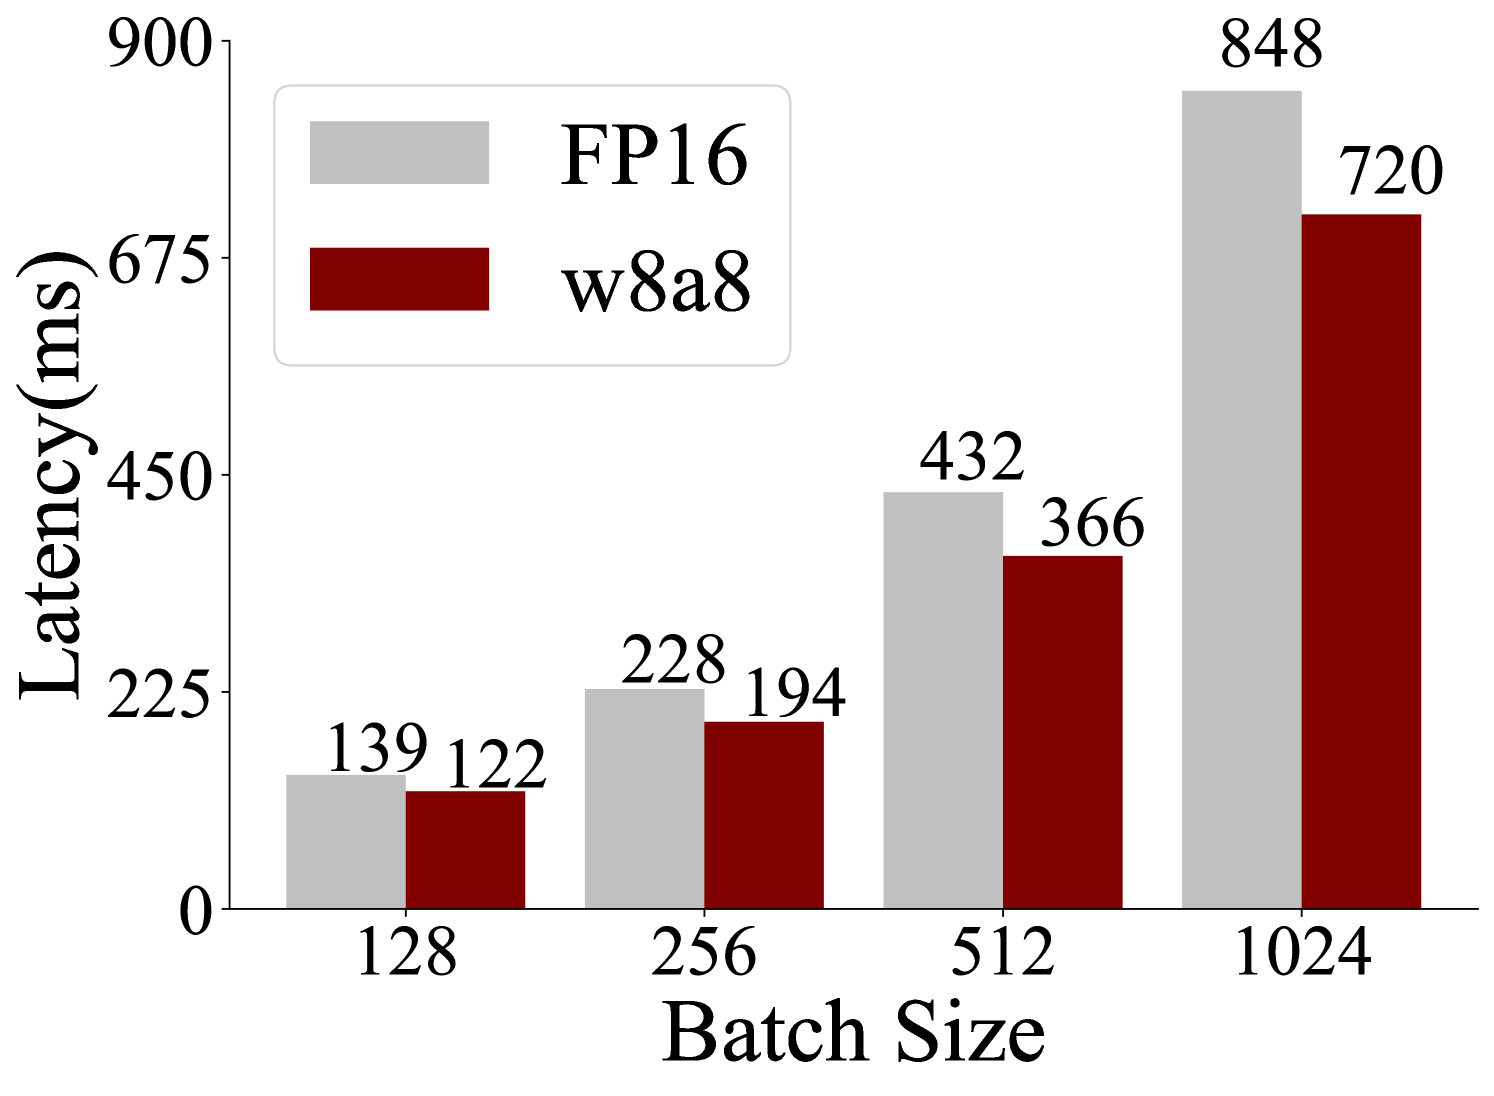
This bar chart displays the latency in milliseconds (ms) for two different configurations, FP16 and w8a8, across varying batch sizes. The x-axis represents the batch size, and the y-axis represents the latency. For each batch size, there are two bars: a light gray bar representing FP16 and a dark red bar representing w8a8.
### Components/Axes
* **Title:** Implicitly, the chart compares latency performance.
* **X-axis Title:** "Batch Size"
* **X-axis Markers:** 128, 256, 512, 1024
* **Y-axis Title:** "Latency(ms)"
* **Y-axis Markers:** 0, 225, 450, 675, 900
* **Legend:** Located in the top-left quadrant of the chart.
* **FP16:** Represented by a light gray rectangle.
* **w8a8:** Represented by a dark red rectangle.
### Detailed Analysis or Content Details
The chart presents data for four distinct batch sizes:
* **Batch Size 128:**
* FP16 (light gray bar): 139 ms
* w8a8 (dark red bar): 122 ms
* **Batch Size 256:**
* FP16 (light gray bar): 228 ms
* w8a8 (dark red bar): 194 ms
* **Batch Size 512:**
* FP16 (light gray bar): 432 ms
* w8a8 (dark red bar): 366 ms
* **Batch Size 1024:**
* FP16 (light gray bar): 848 ms
* w8a8 (dark red bar): 720 ms
### Key Observations
* **Trend:** For both FP16 and w8a8, latency generally increases as the batch size increases. This is visually evident as the bars grow taller with larger batch sizes.
* **Comparison:** In all tested batch sizes, the w8a8 configuration consistently exhibits lower latency compared to the FP16 configuration.
* **Magnitude of Difference:** The difference in latency between FP16 and w8a8 appears to grow with increasing batch size.
* At batch size 128, the difference is approximately 17 ms (139 - 122).
* At batch size 256, the difference is approximately 34 ms (228 - 194).
* At batch size 512, the difference is approximately 66 ms (432 - 366).
* At batch size 1024, the difference is approximately 128 ms (848 - 720).
### Interpretation
This bar chart demonstrates the performance trade-offs between two configurations, FP16 and w8a8, in terms of latency as a function of batch size. The data strongly suggests that the w8a8 configuration is more efficient, offering lower latency across all tested batch sizes. Furthermore, the performance advantage of w8a8 over FP16 becomes more pronounced at larger batch sizes. This implies that for applications requiring high throughput (larger batch sizes) and low latency, the w8a8 configuration would be the preferred choice. The increasing latency with batch size is a common characteristic in many computational tasks, as larger workloads can lead to increased processing time and resource contention. The consistent superiority of w8a8 indicates a potential optimization in its architecture or implementation that allows it to handle larger batches with less overhead.