\n
## Histogram: Number of Definitions and Theorems Across Samples
### Overview
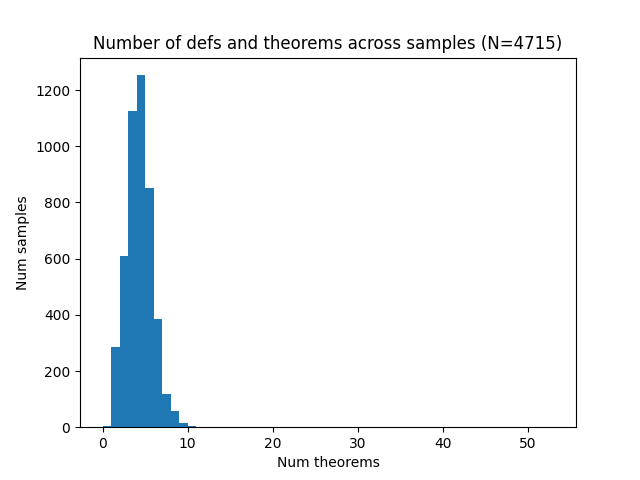
The image presents a histogram visualizing the distribution of the number of theorems across a sample of 4715 items. The x-axis represents the number of theorems, and the y-axis represents the number of samples. The data is presented as a series of bins, showing the frequency of each number of theorems.
### Components/Axes
* **Title:** "Number of defs and theorems across samples (N=4715)"
* **X-axis Label:** "Num theorems"
* **X-axis Scale:** Ranges from 0 to approximately 50, with increments of 10.
* **Y-axis Label:** "Num samples"
* **Y-axis Scale:** Ranges from 0 to approximately 1200, with increments of 200.
* **Data Series:** A single histogram series, filled with a blue color.
### Detailed Analysis
The histogram shows a strong right skew. The distribution is heavily concentrated towards lower numbers of theorems.
* **Peak:** The highest frequency occurs between 5 and 8 theorems, with a peak value of approximately 1250 samples.
* **Trend:** The number of samples decreases rapidly as the number of theorems increases.
* **Data Points (Approximate):**
* 0-1 theorems: ~200 samples
* 1-2 theorems: ~400 samples
* 2-3 theorems: ~600 samples
* 3-4 theorems: ~800 samples
* 4-5 theorems: ~1000 samples
* 5-6 theorems: ~1250 samples
* 6-7 theorems: ~1100 samples
* 7-8 theorems: ~900 samples
* 8-9 theorems: ~650 samples
* 9-10 theorems: ~400 samples
* 10-11 theorems: ~250 samples
* 11-12 theorems: ~150 samples
* 12-13 theorems: ~80 samples
* 13-14 theorems: ~40 samples
* 14-15 theorems: ~20 samples
* 15-20 theorems: ~50 samples (combined)
* 20-50 theorems: ~50 samples (combined)
### Key Observations
* The vast majority of samples have a small number of theorems (less than 10).
* There is a long tail extending to higher numbers of theorems, but the frequency is very low.
* The distribution is not symmetrical.
### Interpretation
The data suggests that most of the analyzed items (definitions and theorems) contain a relatively small number of theorems. This could indicate that the items are primarily focused on basic concepts or that the theorems are often implicit rather than explicitly stated. The long tail suggests that some items are significantly more complex and contain a large number of theorems, but these are relatively rare. The skewness indicates that the number of theorems is not uniformly distributed across the samples. This could be due to the nature of the data itself, or it could be a result of the sampling method. The sample size of 4715 is reasonably large, suggesting that the observed distribution is likely representative of the underlying population.