## Bar Chart: Average Accuracy by Cluster Count and Sparsity
### Overview
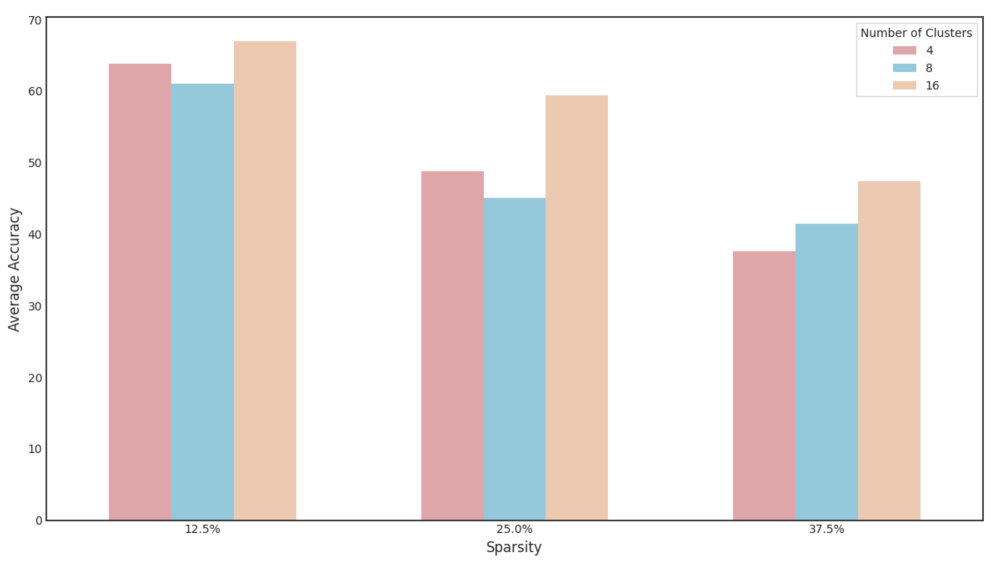
The chart compares average accuracy across three cluster configurations (4, 8, 16 clusters) at three sparsity levels (12.5%, 25%, 37.5%). Accuracy is measured on a 0-70 scale, with higher values indicating better performance. Each cluster configuration is represented by a distinct color: red (4 clusters), blue (8 clusters), and orange (16 clusters).
### Components/Axes
- **X-axis**: Sparsity levels (12.5%, 25%, 37.5%)
- **Y-axis**: Average Accuracy (0-70 scale)
- **Legend**: Located in the top-right corner, mapping colors to cluster counts:
- Red = 4 clusters
- Blue = 8 clusters
- Orange = 16 clusters
- **Bars**: Grouped by sparsity level, with three bars per group (one per cluster configuration)
### Detailed Analysis
1. **12.5% Sparsity**:
- 4 clusters (red): ~63 accuracy
- 8 clusters (blue): ~61 accuracy
- 16 clusters (orange): ~67 accuracy
2. **25% Sparsity**:
- 4 clusters (red): ~48 accuracy
- 8 clusters (blue): ~45 accuracy
- 16 clusters (orange): ~59 accuracy
3. **37.5% Sparsity**:
- 4 clusters (red): ~37 accuracy
- 8 clusters (blue): ~41 accuracy
- 16 clusters (orange): ~47 accuracy
### Key Observations
- **Cluster Count Impact**: Higher cluster counts consistently achieve better accuracy across all sparsity levels.
- **Sparsity Impact**: Accuracy declines as sparsity increases, with steeper drops observed in lower cluster configurations.
- **16-Cluster Advantage**: The 16-cluster configuration maintains ~10-15 accuracy points above the 4-cluster configuration at equivalent sparsity levels.
- **Color Consistency**: All legend colors match bar colors exactly (red/blue/orange).
### Interpretation
The data demonstrates that increasing cluster count improves robustness to sparsity. The 16-cluster configuration shows the most stable performance, retaining ~67% accuracy at 12.5% sparsity and ~47% at 37.5% sparsity. This suggests that higher cluster counts may better capture underlying patterns in sparse data environments. The linear decline in accuracy with increasing sparsity indicates a fundamental trade-off between data complexity and model performance. Notably, the 8-cluster configuration shows diminishing returns compared to the 16-cluster setup, particularly at higher sparsity levels.