\n
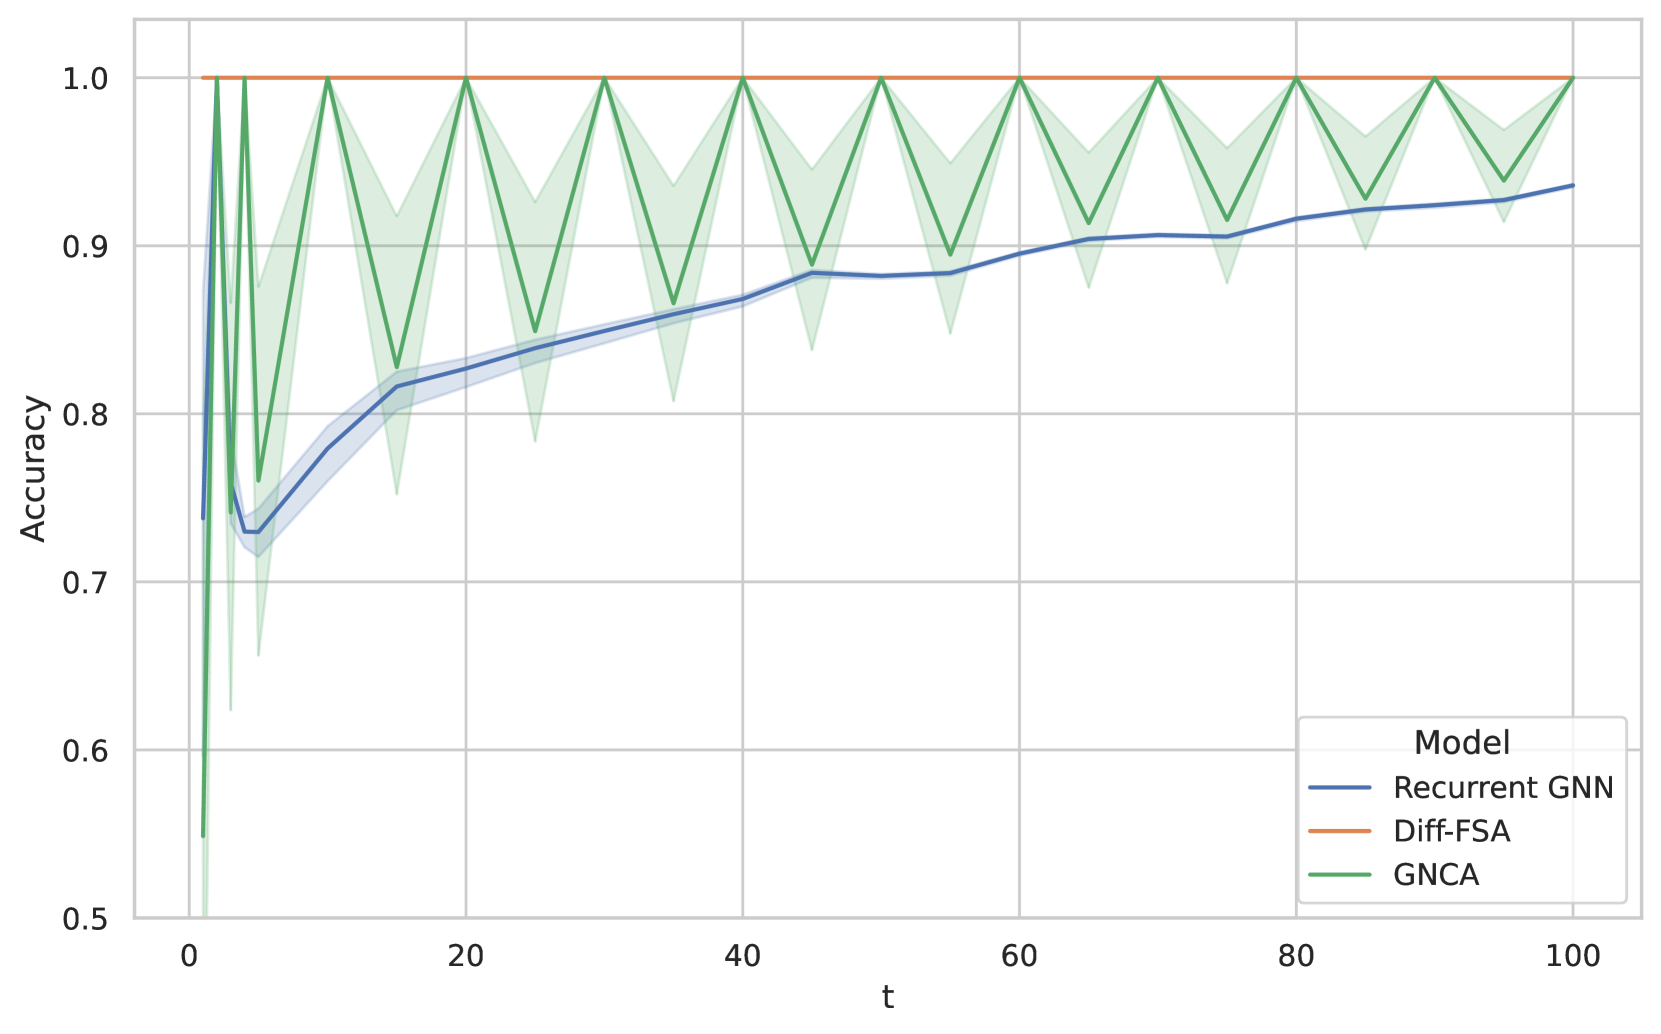
## Line Chart: Accuracy vs. Time (t)
### Overview
This image presents a line chart comparing the accuracy of three different models – Recurrent GNN, Diff-FSA, and GNCA – over time, represented by the variable 't'. The chart displays how the accuracy of each model evolves from t=0 to t=100. A shaded region surrounds the GNCA line, indicating a measure of variance or confidence interval.
### Components/Axes
* **X-axis:** Labeled "t", representing time. The scale ranges from approximately 0 to 100.
* **Y-axis:** Labeled "Accuracy", representing the accuracy score. The scale ranges from approximately 0.5 to 1.0.
* **Legend:** Located in the top-right corner, identifying the three models:
* Recurrent GNN (Blue line)
* Diff-FSA (Orange line)
* GNCA (Green line) with a shaded light green region.
### Detailed Analysis
The chart shows three distinct accuracy curves.
* **Recurrent GNN (Blue):** The line starts at approximately 0.73 at t=0, gradually increases, and appears to plateau around 0.92 between t=60 and t=100. The trend is generally upward, with a decreasing rate of increase over time.
* t=0: ~0.73
* t=10: ~0.78
* t=20: ~0.82
* t=30: ~0.86
* t=40: ~0.88
* t=50: ~0.90
* t=60: ~0.91
* t=70: ~0.92
* t=80: ~0.92
* t=100: ~0.92
* **Diff-FSA (Orange):** The line begins at approximately 0.75 at t=0, quickly rises to approximately 0.98 around t=5, and then remains relatively stable, fluctuating slightly between approximately 0.97 and 1.0 for the remainder of the time period.
* t=0: ~0.75
* t=5: ~0.98
* t=10: ~0.99
* t=20: ~0.98
* t=30: ~0.98
* t=40: ~0.98
* t=50: ~0.98
* t=60: ~0.98
* t=70: ~0.98
* t=80: ~0.98
* t=100: ~0.98
* **GNCA (Green):** The line starts at approximately 0.98 at t=0, exhibits significant oscillations throughout the time period, fluctuating between approximately 0.9 and 1.0. The shaded region indicates a substantial variance around this line.
* t=0: ~0.98
* t=5: ~0.95
* t=10: ~1.0
* t=15: ~0.96
* t=20: ~0.92
* t=25: ~1.0
* t=30: ~0.94
* t=35: ~0.98
* t=40: ~0.92
* t=45: ~1.0
* t=50: ~0.95
* t=55: ~0.98
* t=60: ~0.93
* t=65: ~1.0
* t=70: ~0.96
* t=75: ~0.98
* t=80: ~0.94
* t=85: ~0.98
* t=90: ~0.96
* t=95: ~0.98
* t=100: ~0.97
### Key Observations
* Diff-FSA achieves the highest accuracy and maintains it consistently throughout the observed time period.
* GNCA exhibits the highest variability in accuracy, with significant fluctuations.
* Recurrent GNN shows a steady increase in accuracy, but ultimately reaches a lower plateau compared to Diff-FSA.
* The initial accuracy of all three models is relatively similar, around 0.73-0.75.
### Interpretation
The data suggests that Diff-FSA is the most robust and accurate model for the given task, consistently achieving high accuracy levels. GNCA, while starting with high accuracy, is prone to significant performance fluctuations, indicating potential instability or sensitivity to the input data. Recurrent GNN demonstrates a learning curve, improving its accuracy over time, but ultimately falls short of the performance of Diff-FSA. The shaded region around the GNCA line suggests that the model's performance is highly variable, and the reported accuracy may not be representative of all instances. The consistent high accuracy of Diff-FSA could be due to its architecture or training process, making it less susceptible to variations in the input data. The increasing accuracy of Recurrent GNN suggests that it benefits from continued exposure to data, but may require more time or data to reach optimal performance.