## Bar Chart: Average Episode Length Comparison
### Overview
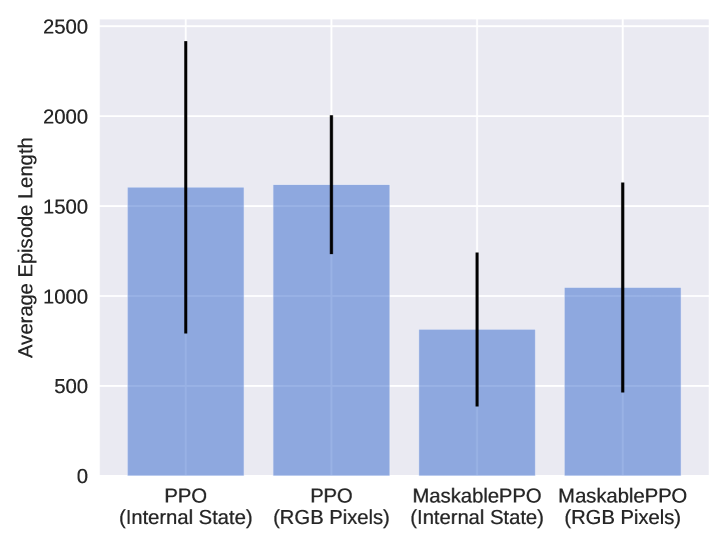
The chart compares the average episode lengths of four variations of a reinforcement learning algorithm: PPO (Internal State), PPO (RGB Pixels), MaskablePPO (Internal State), and MaskablePPO (RGB Pixels). Each bar represents the mean episode length with error bars indicating variability.
### Components/Axes
- **X-Axis**: Categorical labels for the four methods:
1. PPO (Internal State)
2. PPO (RGB Pixels)
3. MaskablePPO (Internal State)
4. MaskablePPO (RGB Pixels)
- **Y-Axis**: "Average Episode Length" (0–2500), with increments of 500.
- **Error Bars**: Vertical black lines on each bar representing variability (approximate ranges):
- PPO (Internal State): ~800–2400
- PPO (RGB Pixels): ~1200–2000
- MaskablePPO (Internal State): ~400–1200
- MaskablePPO (RGB Pixels): ~500–1600
- **Legend**: Not explicitly present in the image.
### Detailed Analysis
- **PPO (Internal State)**: Tallest bar (~1600 average), with the largest error bar (~800–2400). Suggests high variability in episode lengths.
- **PPO (RGB Pixels)**: Slightly taller than PPO (Internal State) (~1650 average), with a smaller error bar (~1200–2000). Indicates marginally higher average but reduced variability.
- **MaskablePPO (Internal State)**: Shortest bar (~800 average), with a moderate error bar (~400–1200). Lower average but higher relative variability compared to MaskablePPO (RGB Pixels).
- **MaskablePPO (RGB Pixels)**: Intermediate bar (~1050 average), with the smallest error bar (~500–1600). Balances lower average length with tighter variability.
### Key Observations
1. **PPO Methods**: Both PPO variants show higher average episode lengths but exhibit significant variability (large error bars).
2. **MaskablePPO Methods**: Lower average lengths but tighter error bars, suggesting more consistent performance.
3. **RGB Pixels vs. Internal State**: For both PPO and MaskablePPO, using RGB pixels results in slightly higher average lengths but reduced variability compared to internal state representations.
### Interpretation
The data suggests that MaskablePPO variants achieve shorter but more stable episode lengths, potentially indicating improved efficiency or reduced exploration time. The larger error bars for PPO methods imply greater sensitivity to initial conditions or hyperparameters. The use of RGB pixels across all methods correlates with marginally better performance (higher averages and tighter variability), possibly due to richer input data. However, the trade-off between episode length and stability warrants further investigation into the underlying algorithmic mechanisms.