## Diagram: Knowledge Graph Types
### Overview
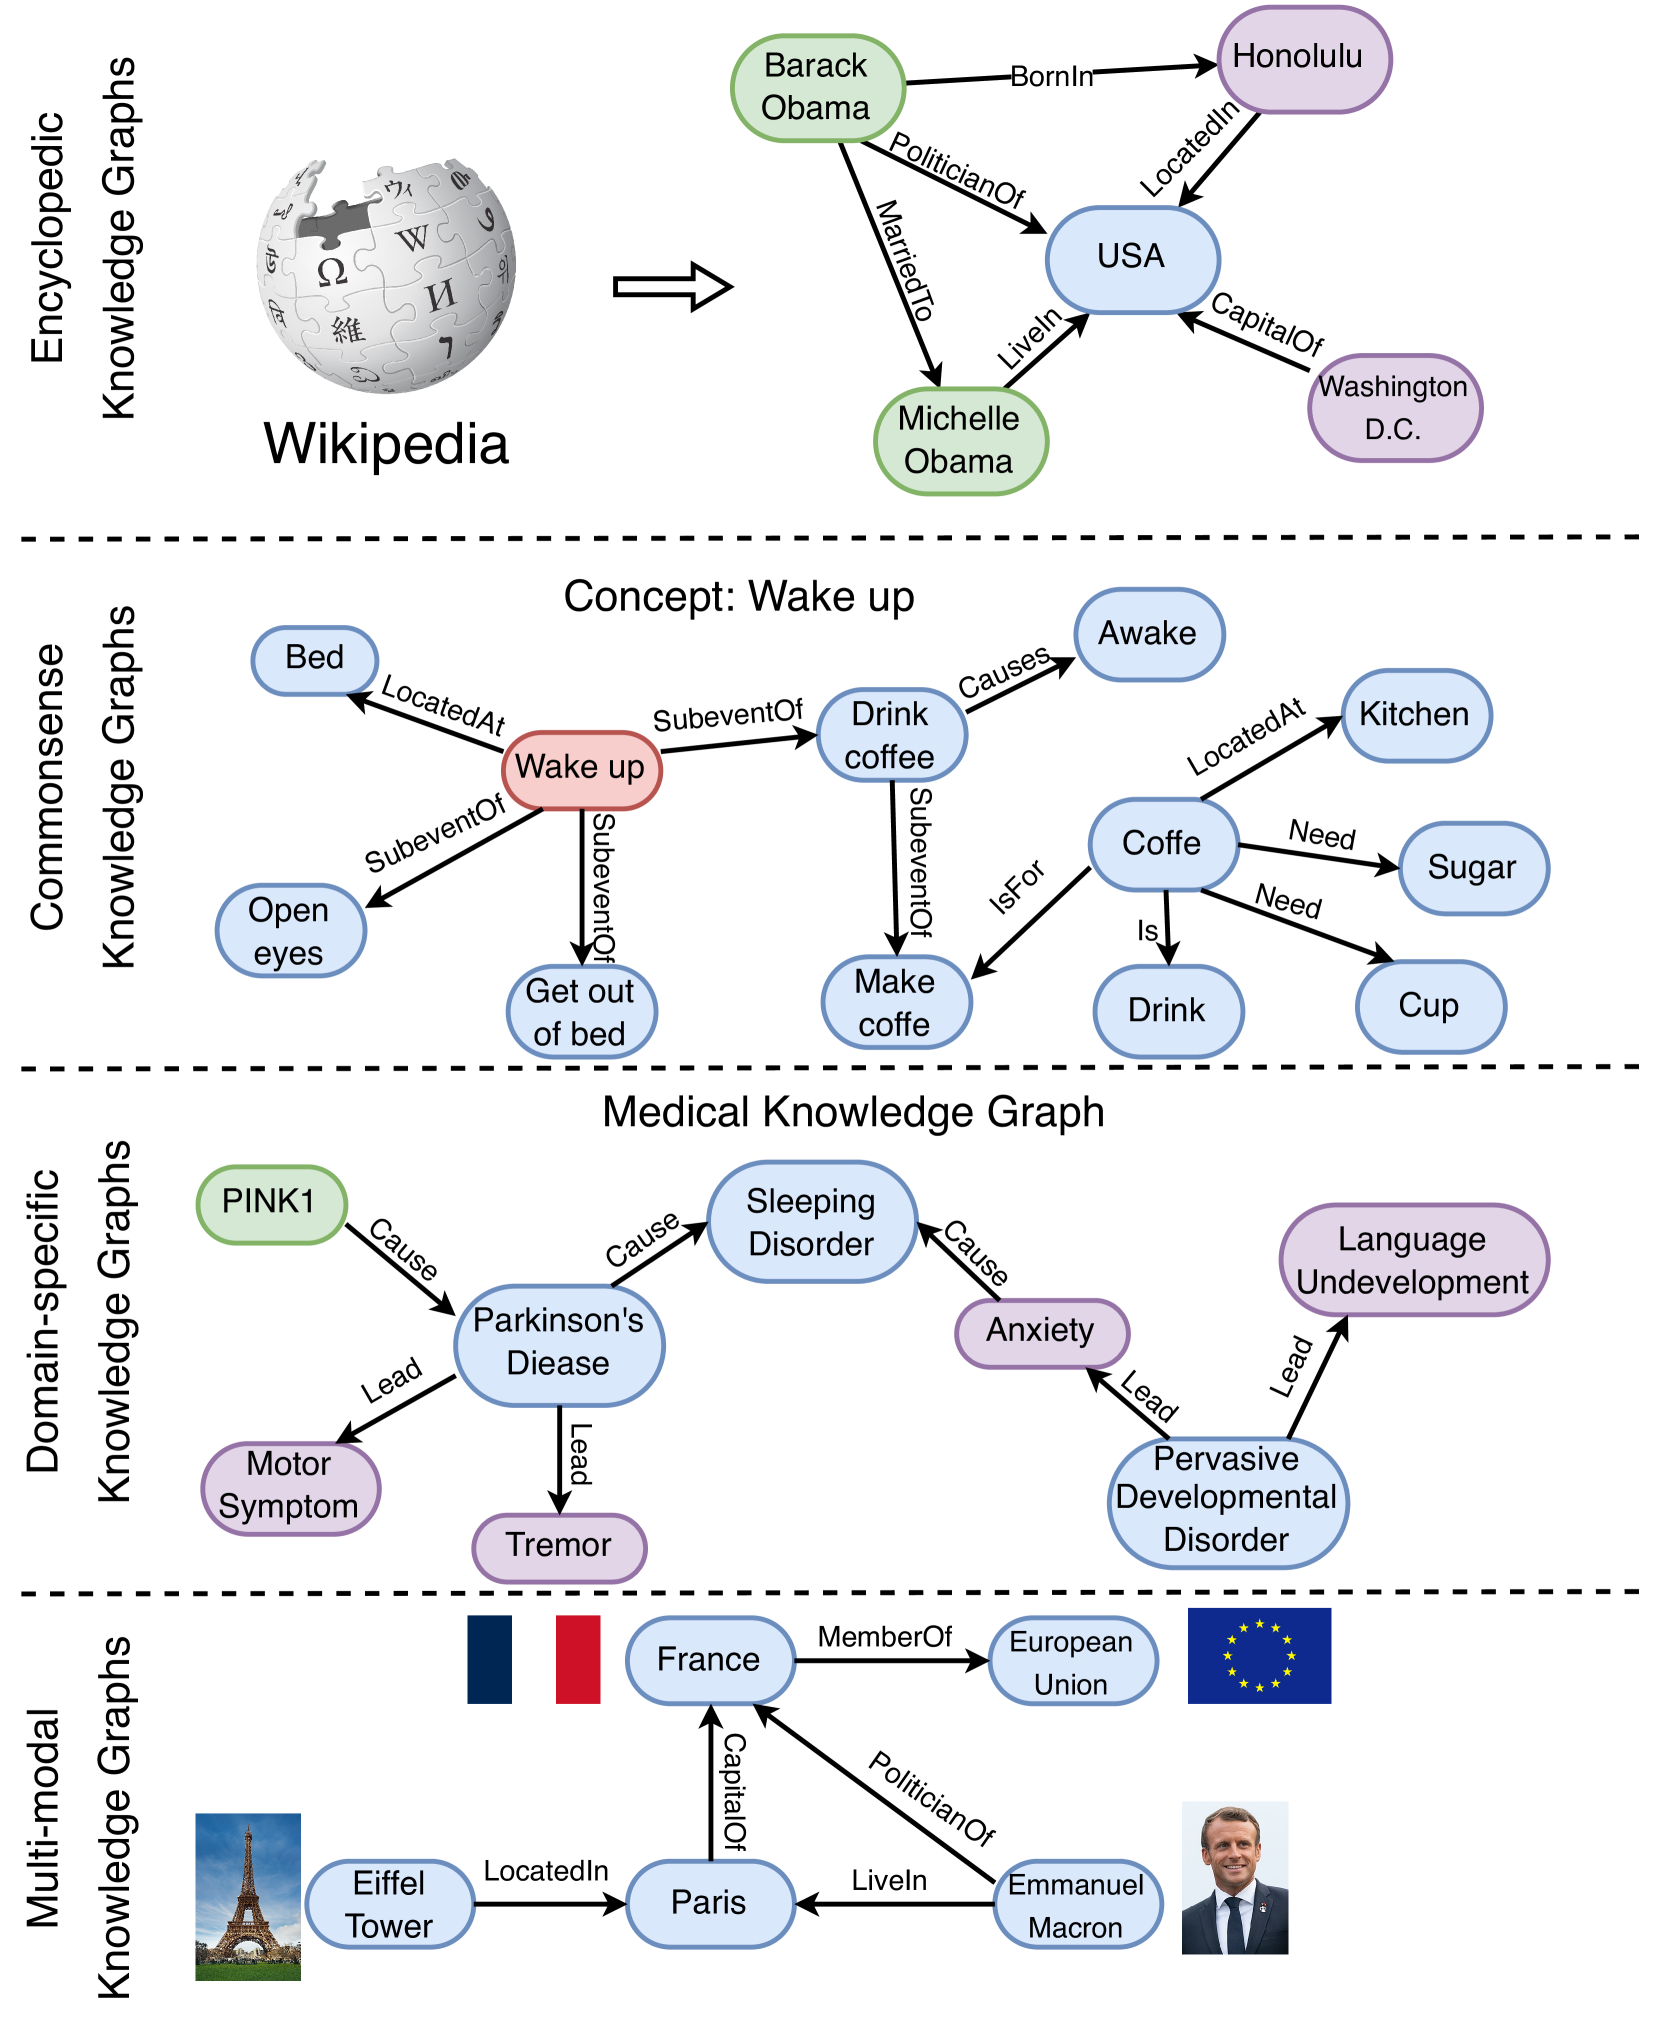
The image presents a comparative diagram illustrating four types of knowledge graphs: Encyclopedic, Commonsense, Domain-specific (Medical), and Multi-modal. Each graph type is visually represented with a small illustrative image on the left, followed by a network of nodes and labeled edges demonstrating relationships between concepts. The diagram aims to showcase the different kinds of knowledge and relationships each graph type can represent.
### Components/Axes
The diagram is structured vertically into four distinct sections, each representing a knowledge graph type. Each section contains:
* **Illustrative Image:** A small image representing the domain of the knowledge graph.
* **Nodes:** Oval-shaped nodes representing concepts or entities.
* **Edges:** Arrows connecting nodes, labeled with the type of relationship between the connected concepts.
* **Labels:** Text labels associated with nodes and edges, describing the concepts and relationships.
### Detailed Analysis or Content Details
**1. Encyclopedic Knowledge Graphs:**
* **Image:** Wikipedia logo.
* **Nodes:** Barack Obama, Politician, Honolulu, USA, Michelle Obama, Washington D.C.
* **Edges:**
* Barack Obama - BornIn -> Honolulu
* Barack Obama - IsA -> Politician
* Barack Obama - MarriedTo -> Michelle Obama
* Michelle Obama - LivesIn -> USA
* USA - CapitalOf -> Washington D.C.
**2. Commonsense Knowledge Graphs:**
* **Concept:** "Wake up" is prominently displayed.
* **Nodes:** Bed, Open eyes, Wake up, Get out of bed, Drink coffee, Make coffee, Coffee, Sugar, Cup, Kitchen, Awake.
* **Edges:**
* Bed - LocatedAt -> Wake up
* Open eyes - SubEventOf -> Wake up
* Wake up - SubEventOf -> Get out of bed
* Get out of bed - SubEventOf -> Make coffee
* Make coffee - IsFor -> Drink coffee
* Drink coffee - Causes -> Awake
* Coffee - Need -> Sugar
* Coffee - Need -> Cup
* Awake - LocatedAt -> Kitchen
**3. Domain-specific Knowledge Graph (Medical):**
* **Nodes:** PINK1, Parkinson’s Disease, Sleeping Disorder, Anxiety, Language Undevelopment, Motor Symptom, Tremor, Pervasive Developmental Disorder.
* **Edges:**
* PINK1 - Cause -> Parkinson’s Disease
* Parkinson’s Disease - LeadTo -> Tremor
* Parkinson’s Disease - Cause -> Sleeping Disorder
* Sleeping Disorder - Cause -> Anxiety
* Anxiety - LeadTo -> Language Undevelopment
* Language Undevelopment - LeadTo -> Pervasive Developmental Disorder
* Motor Symptom - LeadTo -> Tremor
**4. Multi-modal Knowledge Graph:**
* **Image:** Eiffel Tower.
* **Nodes:** Eiffel Tower, Paris, France, European Union, Emmanuel Macron.
* **Edges:**
* Eiffel Tower - LocatedIn -> Paris
* Paris - CapitalOf -> France
* Emmanuel Macron - PoliticianOf -> France
* France - MemberOf -> European Union
### Key Observations
* The complexity of the graphs varies. The Encyclopedic graph is the simplest, while the Commonsense and Medical graphs are more intricate.
* The relationships are explicitly labeled, providing clarity on how concepts are connected.
* The diagram demonstrates how knowledge graphs can represent different types of information, from factual data (Encyclopedic) to everyday understanding (Commonsense) to specialized knowledge (Medical) and multimodal data (Multi-modal).
* The use of illustrative images helps to ground the graphs in specific domains.
### Interpretation
The diagram illustrates the versatility of knowledge graphs as a method for representing and organizing information. Each type of graph serves a different purpose and caters to different needs. Encyclopedic graphs focus on factual knowledge, while Commonsense graphs capture everyday understanding. Domain-specific graphs provide specialized knowledge within a particular field, and Multi-modal graphs integrate information from various sources, including images and text. The diagram suggests that knowledge graphs are not a one-size-fits-all solution but rather a flexible framework that can be adapted to different contexts and applications. The relationships between nodes are crucial, as they define the meaning and context of the information. The diagram highlights the importance of explicitly defining these relationships to ensure accurate and meaningful knowledge representation. The diagram is a conceptual illustration and does not contain specific numerical data or statistical analysis. It is a qualitative representation of different knowledge graph types.