## Chart: Per-Token Loss vs. Token Index & Step
### Overview
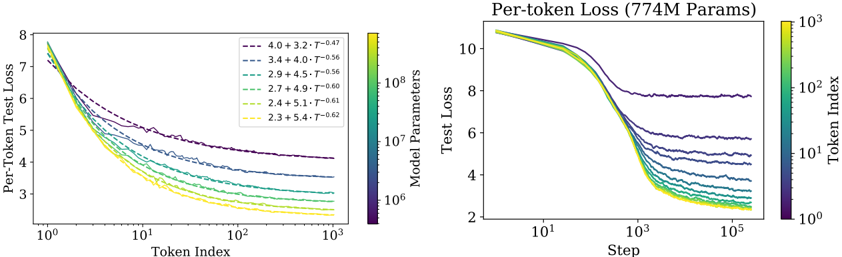
The image presents two charts displaying per-token loss as a function of token index (left) and step (right). Both charts show multiple lines representing different model parameter sizes, with a color gradient indicating the token index or step. The right chart has a title indicating the model size is 774M parameters.
### Components/Axes
**Left Chart:**
* **X-axis:** Token Index (logarithmic scale, ranging from approximately 10^2 to 10^3).
* **Y-axis:** Per-Token Test Loss (ranging from approximately 3 to 8).
* **Lines:** Represent different model parameter configurations. Each line is labeled with a parameter configuration (e.g., "4.0 + 3.2 • T^-0.47").
* **Colorbar:** Located on the right, representing Token Index with a gradient from green to yellow to red.
**Right Chart:**
* **X-axis:** Step (logarithmic scale, ranging from approximately 10^1 to 10^5).
* **Y-axis:** Test Loss (ranging from approximately 2 to 10).
* **Lines:** Represent different model parameter configurations. Each line is labeled with a parameter configuration (e.g., "4.0 + 3.2 • T^-0.47").
* **Colorbar:** Located on the right, representing Token Index with a gradient from green to yellow to red.
* **Title:** "Per-token Loss (774M Params)"
### Detailed Analysis or Content Details
**Left Chart:**
* **Line 1 (Purple):** 4.0 + 3.2 • T^-0.47. Starts at approximately 7.5 and decreases to approximately 4.5. The line exhibits some oscillation.
* **Line 2 (Dark Blue):** 3.4 + 4.0 • T^-0.56. Starts at approximately 7.0 and decreases to approximately 4.0. The line exhibits some oscillation.
* **Line 3 (Green):** 2.9 + 4.5 • T^-0.56. Starts at approximately 6.5 and decreases to approximately 3.5. The line exhibits some oscillation.
* **Line 4 (Light Green):** 2.7 + 4.9 • T^-0.60. Starts at approximately 6.0 and decreases to approximately 3.2. The line exhibits some oscillation.
* **Line 5 (Yellow):** 2.4 + 5.1 • T^-0.61. Starts at approximately 5.5 and decreases to approximately 3.0. The line exhibits some oscillation.
* **Line 6 (Orange):** 2.3 + 5.4 • T^-0.62. Starts at approximately 5.0 and decreases to approximately 2.8. The line exhibits some oscillation.
**Right Chart:**
* **Line 1 (Purple):** 4.0 + 3.2 • T^-0.47. Starts at approximately 9.0 and decreases rapidly to approximately 4.5, then plateaus with some oscillation.
* **Line 2 (Dark Blue):** 3.4 + 4.0 • T^-0.56. Starts at approximately 8.5 and decreases rapidly to approximately 4.0, then plateaus with some oscillation.
* **Line 3 (Green):** 2.9 + 4.5 • T^-0.56. Starts at approximately 8.0 and decreases rapidly to approximately 3.5, then plateaus with some oscillation.
* **Line 4 (Light Green):** 2.7 + 4.9 • T^-0.60. Starts at approximately 7.5 and decreases rapidly to approximately 3.2, then plateaus with some oscillation.
* **Line 5 (Yellow):** 2.4 + 5.1 • T^-0.61. Starts at approximately 7.0 and decreases rapidly to approximately 3.0, then plateaus with some oscillation.
* **Line 6 (Orange):** 2.3 + 5.4 • T^-0.62. Starts at approximately 6.5 and decreases rapidly to approximately 2.8, then plateaus with some oscillation.
### Key Observations
* In both charts, the lines generally trend downwards, indicating decreasing loss as token index or step increases.
* The lines with larger initial parameter values (e.g., 4.0 + 3.2) start with higher loss but decrease more slowly.
* The lines with smaller initial parameter values (e.g., 2.3 + 5.4) start with lower loss and decrease more rapidly.
* All lines exhibit some degree of oscillation, suggesting instability or fluctuations in the learning process.
* The color gradient on the colorbar does not appear to be directly correlated with the line colors.
### Interpretation
The charts demonstrate the relationship between model parameters, token index/step, and per-token loss during training. The different lines represent models with varying parameter configurations. The decreasing loss indicates that the models are learning and improving their performance as they process more tokens or steps. The parameter configurations influence the initial loss and the rate of learning. The oscillations suggest that the training process is not perfectly smooth and may require adjustments to hyperparameters or optimization algorithms. The right chart, specifically, shows how the loss converges as the model progresses through training steps. The 774M parameter size indicates the scale of the models being evaluated. The data suggests that there is a trade-off between initial loss and learning rate, with larger parameter values leading to higher initial loss but potentially slower learning. The colorbar, while present, doesn't seem to provide additional information about the data itself, and may be a visual artifact or represent a different dimension not directly displayed on the charts.