## Scatter Plot: LongBench Accuracy vs KV Cache Size (PassageCnt Dataset)
### Overview
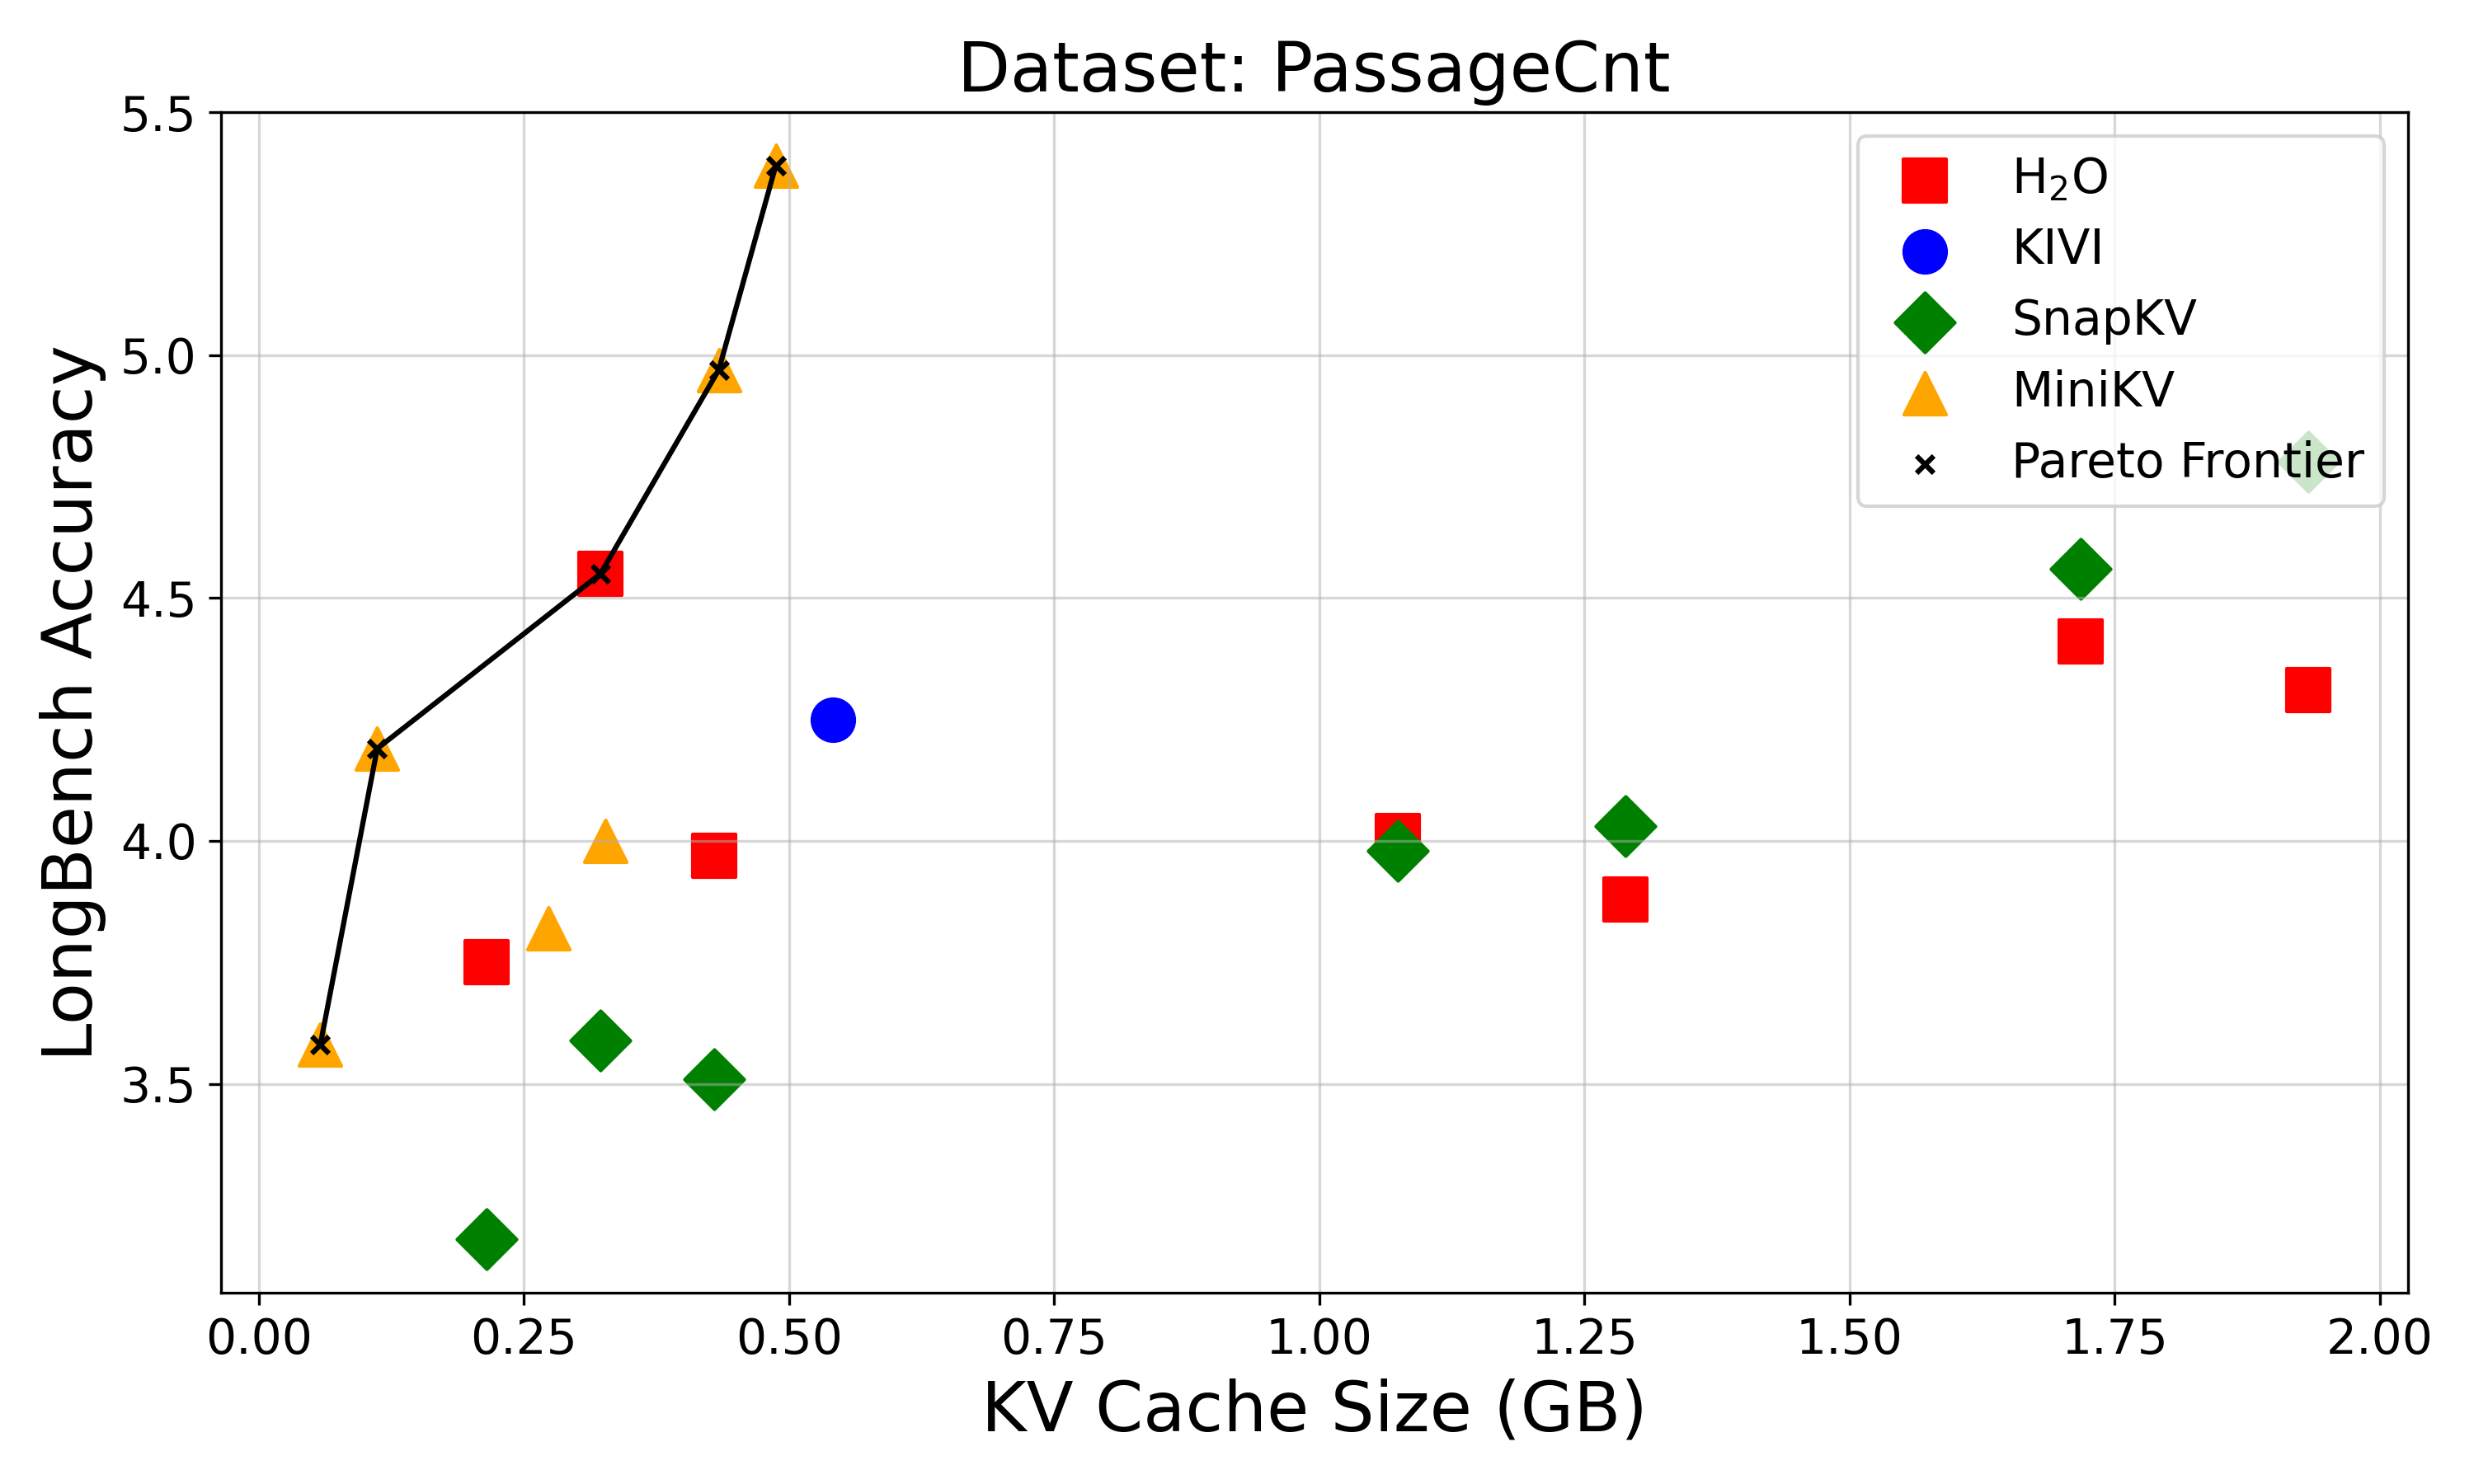
The chart visualizes the relationship between KV cache size (in GB) and LongBench accuracy for five different systems (H2O, KIVI, SnapKV, MiniKV) against the Pareto Frontier. Data points are plotted with distinct markers, and the Pareto Frontier is represented by a connected line.
### Components/Axes
- **X-axis**: KV Cache Size (GB) ranging from 0.00 to 2.00 in 0.25 increments.
- **Y-axis**: LongBench Accuracy ranging from 3.5 to 5.5 in 0.5 increments.
- **Legend**: Located in the top-right corner, with five entries:
- Red square: H2O
- Blue circle: KIVI
- Green diamond: SnapKV
- Yellow triangle: MiniKV
- Black cross: Pareto Frontier
### Detailed Analysis
1. **H2O (Red Squares)**:
- Points at (0.25, 3.8), (0.5, 4.0), (1.25, 3.9), (1.75, 4.4), (2.0, 4.3).
- Trend: Slight upward slope with a plateau at larger cache sizes.
2. **KIVI (Blue Circle)**:
- Single point at (0.5, 4.2).
- No clear trend due to limited data.
3. **SnapKV (Green Diamonds)**:
- Points at (0.25, 3.2), (0.5, 3.5), (1.0, 4.0), (1.25, 4.1), (1.75, 4.6).
- Trend: Steady upward slope, especially after 1.0 GB.
4. **MiniKV (Yellow Triangles)**:
- Points at (0.1, 3.6), (0.3, 3.8), (0.5, 4.0), (0.7, 4.2), (1.0, 4.5).
- Trend: Consistent upward trajectory with no plateau.
5. **Pareto Frontier (Black Crosses)**:
- Connects points: (0.1, 3.6) → (0.3, 3.8) → (0.5, 4.0) → (0.7, 4.2) → (1.0, 4.5) → (1.75, 4.6) → (2.0, 4.3).
- Represents optimal trade-offs between cache size and accuracy.
### Key Observations
- **Pareto Frontier Dominance**: The frontier line consistently lies above or near most data points, indicating it represents the most efficient configurations.
- **MiniKV and SnapKV Outperformance**: Both systems show higher accuracy at larger cache sizes (e.g., SnapKV reaches 4.6 at 1.75 GB, MiniKV reaches 4.5 at 1.0 GB).
- **H2O Plateau**: H2O’s accuracy stabilizes around 4.3–4.4 despite increasing cache size beyond 1.75 GB.
- **KIVI Anomaly**: Only one data point suggests limited evaluation or unique constraints.
### Interpretation
The data demonstrates that **cache size directly impacts accuracy**, but with diminishing returns for most systems. The Pareto Frontier highlights the optimal balance, where MiniKV and SnapKV outperform others at larger cache sizes. H2O’s plateau suggests potential architectural limits, while KIVI’s single data point warrants further investigation. The trend implies that systems like MiniKV and SnapKV scale more effectively with increased resources, making them preferable for high-accuracy applications.