## Line Chart: Accuracy vs. Thinking Compute
### Overview
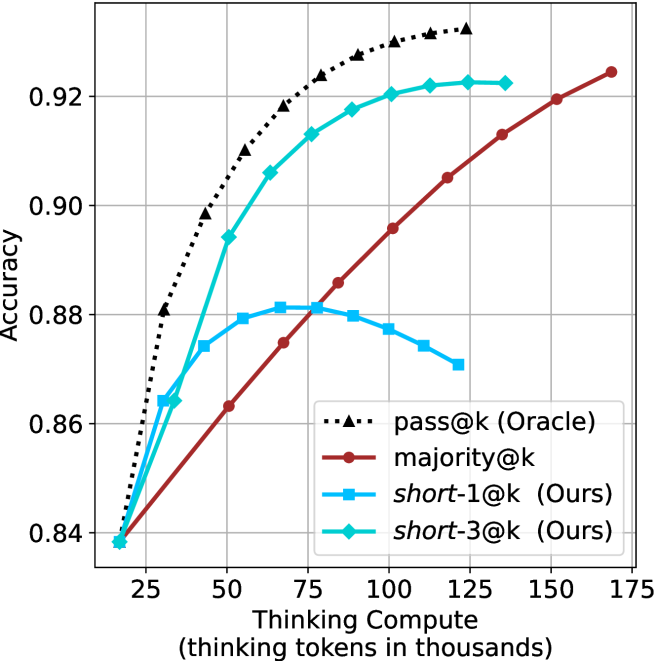
This chart illustrates the relationship between "Thinking Compute" (measured in thousands of thinking tokens) and model "Accuracy" across four different evaluation strategies. It demonstrates how different methods scale as more computational resources are allocated to the "thinking" process.
### Components/Axes
* **X-Axis**: "Thinking Compute (thinking tokens in thousands)". The scale ranges from approximately 15 to 175, with major grid lines at 25, 50, 75, 100, 125, 150, and 175.
* **Y-Axis**: "Accuracy". The scale ranges from 0.84 to 0.92+, with major grid lines at 0.84, 0.86, 0.88, 0.90, and 0.92.
* **Legend**: Located in the bottom-right quadrant of the chart.
* **Black dotted line with triangle markers**: `pass@k (Oracle)`
* **Dark red solid line with circle markers**: `majority@k`
* **Light blue solid line with square markers**: `short-1@k (Ours)`
* **Cyan/Teal solid line with diamond markers**: `short-3@k (Ours)`
### Detailed Analysis
All four data series originate from a common starting point at approximately (18, 0.838).
**1. `pass@k (Oracle)` (Black dotted line, triangles)**
* **Trend**: This series shows the steepest upward trajectory, representing the theoretical upper bound of performance. It is concave down, showing rapid initial gains that taper off as compute increases.
* **Data Points**:
* (30, ~0.88)
* (50, ~0.90)
* (70, ~0.91)
* (100, ~0.93)
* (120, ~0.932)
**2. `short-3@k (Ours)` (Cyan/Teal solid line, diamonds)**
* **Trend**: This series shows strong, consistent growth, tracking closely behind the Oracle. It is the second-highest performing method.
* **Data Points**:
* (30, ~0.865)
* (50, ~0.895)
* (70, ~0.905)
* (90, ~0.918)
* (110, ~0.92)
* (125, ~0.922)
**3. `majority@k` (Dark red solid line, circles)**
* **Trend**: This series exhibits a steady, nearly linear upward slope. It starts as the lowest performer but demonstrates the most consistent long-term scaling.
* **Data Points**:
* (50, ~0.863)
* (75, ~0.875)
* (90, ~0.886)
* (110, ~0.895)
* (135, ~0.913)
* (165, ~0.925)
**4. `short-1@k (Ours)` (Light blue solid line, squares)**
* **Trend**: This series shows an initial increase, peaking, and then a distinct decline. It demonstrates diminishing returns followed by negative returns.
* **Data Points**:
* (30, ~0.865)
* (50, ~0.875)
* (75, ~0.881) - *Peak*
* (100, ~0.877)
* (120, ~0.87)
### Key Observations
* **Performance Crossover**: The `majority@k` method overtakes the `short-1@k` method at approximately 80k tokens.
* **The "Overthinking" Phenomenon**: The `short-1@k` method is the only one that exhibits a negative slope after a certain compute threshold (~75k tokens), suggesting that forcing the model to "think" longer under this specific constraint leads to accuracy degradation (likely due to hallucination or over-complication).
* **Efficiency**: The `short-3@k` method is highly efficient, achieving ~0.92 accuracy with significantly less compute (approx. 110k tokens) than the `majority@k` method (which requires ~165k tokens to reach a similar level).
### Interpretation
The data suggests a clear trade-off between compute allocation and evaluation strategy.
* **Oracle/Upper Bound**: The `pass@k (Oracle)` represents the ceiling of what is possible, confirming that the underlying model has the capacity for high accuracy if the correct answer is selected.
* **Strategy Efficacy**: The `short-3@k` strategy is the most effective "Ours" method, likely because it allows for a small amount of diversity (3 options) to verify the answer, which balances accuracy and compute efficiency well.
* **Scaling**: `majority@k` is the most robust strategy for high-compute scenarios, as it continues to improve linearly without the performance drop-off seen in `short-1@k`. This implies that for tasks requiring massive compute, a majority-voting mechanism is safer than a single-short-answer constraint.