## Bar Charts: Model Accuracy Comparison
### Overview
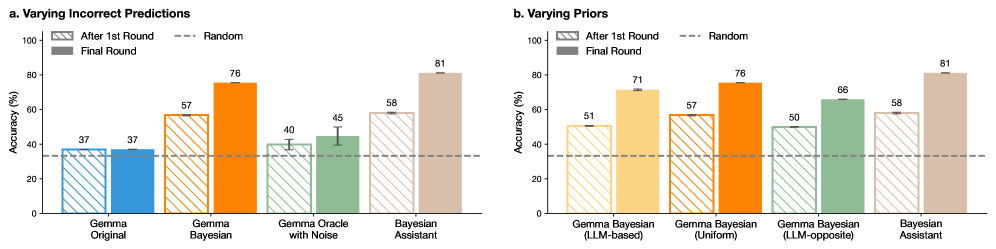
The image displays two side-by-side bar charts comparing the accuracy (in percentage) of different AI model variants across two experimental conditions. Both charts share the same y-axis scale (0-100% Accuracy) and a common legend. The charts are labeled "a. Varying Incorrect Predictions" and "b. Varying Priors."
### Components/Axes
* **Y-Axis (Both Charts):** Labeled "Accuracy (%)". Scale runs from 0 to 100 in increments of 20.
* **X-Axis (Chart a):** Lists four model types: "Gemma Original", "Gemma Bayesian", "Gemma Oracle with Noise", and "Bayesian Assistant".
* **X-Axis (Chart b):** Lists four model types: "Gemma Bayesian (LLM-based)", "Gemma Bayesian (Uniform)", "Gemma Bayesian (LLM-opposite)", and "Bayesian Assistant".
* **Legend (Top-Left of each chart):**
* `After 1st Round`: Represented by hatched/patterned bars.
* `Final Round`: Represented by solid-colored bars.
* `Random`: Represented by a horizontal dashed line.
* **Data Labels:** Numerical accuracy values are printed directly above each bar.
* **Error Bars:** Present on most bars, indicating variability or confidence intervals.
### Detailed Analysis
#### Chart a: Varying Incorrect Predictions
This chart compares model performance when varying the type of incorrect predictions used in training or prompting.
* **Gemma Original:**
* After 1st Round (Blue, hatched): **37%**
* Final Round (Blue, solid): **37%**
* *Trend:* No improvement between rounds.
* **Gemma Bayesian:**
* After 1st Round (Orange, hatched): **57%**
* Final Round (Orange, solid): **76%**
* *Trend:* Significant upward slope from first to final round.
* **Gemma Oracle with Noise:**
* After 1st Round (Green, hatched): **40%**
* Final Round (Green, solid): **45%**
* *Trend:* Slight upward slope.
* **Bayesian Assistant:**
* After 1st Round (Brown, hatched): **58%**
* Final Round (Brown, solid): **81%**
* *Trend:* Strong upward slope, achieving the highest final accuracy in this chart.
* **Random Baseline:** The dashed line is positioned at approximately **33%**.
#### Chart b: Varying Priors
This chart compares model performance when using different prior distributions (LLM-based, Uniform, LLM-opposite) within a Bayesian framework.
* **Gemma Bayesian (LLM-based):**
* After 1st Round (Yellow, hatched): **51%**
* Final Round (Yellow, solid): **71%**
* *Trend:* Strong upward slope.
* **Gemma Bayesian (Uniform):**
* After 1st Round (Orange, hatched): **57%**
* Final Round (Orange, solid): **76%**
* *Trend:* Strong upward slope. (Note: This appears identical to "Gemma Bayesian" in Chart a).
* **Gemma Bayesian (LLM-opposite):**
* After 1st Round (Green, hatched): **50%**
* Final Round (Green, solid): **66%**
* *Trend:* Upward slope.
* **Bayesian Assistant:**
* After 1st Round (Brown, hatched): **58%**
* Final Round (Brown, solid): **81%**
* *Trend:* Strong upward slope, again achieving the highest final accuracy.
* **Random Baseline:** The dashed line is positioned at approximately **33%**.
### Key Observations
1. **Consistent Superiority of Bayesian Assistant:** In both experimental conditions, the "Bayesian Assistant" model achieves the highest final round accuracy (81%).
2. **Universal Improvement:** All models except "Gemma Original" show a clear improvement in accuracy from the "After 1st Round" to the "Final Round." The "Gemma Original" model shows no change.
3. **Impact of Bayesian Methods:** All Bayesian variants (Gemma Bayesian, Gemma Oracle with Noise, Gemma Bayesian with different priors) outperform the non-Bayesian "Gemma Original" in the final round.
4. **Prior Sensitivity (Chart b):** The choice of prior affects performance. The "Uniform" prior (76%) leads to higher final accuracy than the "LLM-based" (71%) or "LLM-opposite" (66%) priors for the Gemma Bayesian model.
5. **Baseline Comparison:** All final round results are substantially above the ~33% random chance baseline.
### Interpretation
The data demonstrates the effectiveness of Bayesian approaches and iterative refinement for improving model accuracy on the given task.
* **Bayesian Frameworks Add Value:** The consistent improvement of Bayesian models over the original Gemma model suggests that incorporating uncertainty estimation (via Bayesian methods) leads to more robust and accurate predictions after iterative refinement.
* **The "Assistant" Architecture is Key:** The "Bayesian Assistant" is the top performer in both charts, indicating its specific architecture or training protocol is particularly well-suited for this task, regardless of the experimental variable being tested (incorrect predictions or priors).
* **Iterative Process is Crucial:** The significant jumps from "After 1st Round" to "Final Round" for most models highlight the importance of the multi-round process. The model learns and corrects itself effectively over iterations.
* **Priors Matter, But Not Dramatically:** While Chart b shows that the uniform prior yields the best results among the tested priors for the standard Gemma Bayesian model, the performance spread (66% to 76%) is less dramatic than the difference between Bayesian and non-Bayesian approaches. This suggests the core Bayesian mechanism is more impactful than the specific prior choice in this context.
* **The Original Model is Stagnant:** The lack of improvement in "Gemma Original" serves as a control, confirming that the gains seen in other models are due to their modified (Bayesian) architectures and the iterative process, not simply from additional rounds of the same procedure.