## Data Table: Operation Latency
### Overview
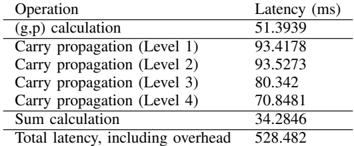
The image presents a data table showing the latency (in milliseconds) for different operations. The operations include (g,p) calculation, carry propagation at four levels, sum calculation, and total latency including overhead.
### Components/Axes
* **Columns:** The table has two columns: "Operation" and "Latency (ms)".
* **Rows:** Each row represents a specific operation and its corresponding latency.
### Detailed Analysis
Here's a breakdown of the data:
| Operation | Latency (ms) |
| ------------------------------- | ------------- |
| (g,p) calculation | 51.3939 |
| Carry propagation (Level 1) | 93.4178 |
| Carry propagation (Level 2) | 93.5273 |
| Carry propagation (Level 3) | 80.342 |
| Carry propagation (Level 4) | 70.8481 |
| Sum calculation | 34.2846 |
| Total latency, including overhead | 528.482 |
* **(g,p) calculation:** 51.3939 ms
* **Carry propagation (Level 1):** 93.4178 ms
* **Carry propagation (Level 2):** 93.5273 ms
* **Carry propagation (Level 3):** 80.342 ms
* **Carry propagation (Level 4):** 70.8481 ms
* **Sum calculation:** 34.2846 ms
* **Total latency, including overhead:** 528.482 ms
### Key Observations
* Carry propagation at levels 1 and 2 have the highest individual latencies among the listed operations.
* The total latency, including overhead, is significantly higher than the sum of the individual operation latencies, indicating a substantial overhead component.
* The latency of carry propagation decreases as the level increases from 2 to 4.
### Interpretation
The data suggests that carry propagation is a significant bottleneck in the overall process, especially at the initial levels (1 and 2). The substantial difference between the sum of individual operation latencies and the total latency indicates that overhead contributes significantly to the overall processing time. The decreasing latency in carry propagation from level 2 to 4 may indicate optimizations or reduced complexity at higher levels.